What we cover in this article
Unlock the power of data-driven decisions with an analytics dashboard. This tool provides real-time insights into business activities, enhancing decision-making and operational efficiency. Discover different types, benefits, and key factors for choosing the right dashboard to streamline your business analytics and drive growth with Minimal Dashboard.
Contents
- Introduction
- Why Listen to Us?
- What Is an Analytics Dashboard?
- Key Benefits of an Analytics Dashboard
- Types of Analytics Dashboards
- Factors To Consider When Choosing an Analytics Dashboard
- Streamline Your Business Analytics with Minimal Dashboard
Introduction
Imagine having a clear, comprehensive view of every activity within your business—from sales and marketing to customer engagement.
Wouldn’t this help to make data-driven decisions that drive growth and success? That’s where analytics dashboard comes in.
In this Minimal Dashboard article, we’ll dive deep into what an analytics dashboard is, its core benefits, types, as well as factors to consider when choosing one.
But first…
Why Listen to Us?
At Minimal Dashboard, we excel in creating intuitive analytics dashboards that centralize vital business metrics in one accessible platform. This allows organizations to track performance in real-time, simplifying decision-making and enhancing operational efficiency.

What Is an Analytics Dashboard?
An analytics dashboard provides real-time performance data for various aspects of a business, such as websites, departments, or projects. It typically displays this data through interactive charts, allowing users to delve deeper into insights by clicking on different sections.
These dashboards serve as essential tools for organizations looking to make data-driven decisions. They replace reliance on instinct or guesswork by offering a comprehensive view of key metrics and trends.
Key Benefits of an Analytics Dashboard
1. Real-time Data Monitoring
Analytics dashboards allow you to track key metrics in real-time, offering instant insights into your business’s performance. This allows for quick, data-driven decisions, such as adjusting marketing campaigns or optimizing inventory based on current trends.
For example, Minimal Dashboard delivers real-time visibility, allowing users to monitor performance continuously and react to changes as they happen.
2. Data Visualization
Dashboards use visuals like charts and graphs to simplify complex data, making it easier to interpret. This visual representation helps teams quickly grasp trends and patterns, allowing for more effective analysis and strategy development.
3. Pattern Recognition and Anomaly Detection
Dashboards enable businesses to identify trends and changes in performance over time. Additionally, they allow for the quick recognition of unexpected data fluctuations, helping teams respond proactively to emerging opportunities or issues.
4. Actionable Insights
By leveraging real-time data, dashboards provide actionable insights that inform strategic decisions across departments—whether in marketing, sales, finance, or operations. This empowers businesses to refine their strategies and adjust plans as needed.
5. Improved Decision Making
With all your data centralized in one place, an analytics dashboard provides a comprehensive view of your business operations. This consolidation enables more informed, data-backed decisions, eliminating guesswork and fostering smarter business strategies.
6. Goal Tracking
Dashboards help you monitor the progress toward your goals, providing a clear snapshot of performance over time. By identifying patterns and trends, they highlight areas that need improvement, ensuring you’re always aligned with your objectives.
7. Increased Efficiency
By reducing manual data collection and analysis, dashboards save time and improve operational efficiency. Decision-makers can act swiftly, relying on the accurate data presented to avoid errors and optimize business processes.
Types of Analytics Dashboards
1. Sales Analytics Dashboard
A crucial tool for sales teams, this dashboard provides insights into sales performance. It helps business owners track sales activities, identify opportunities, and make informed decisions to boost revenue. Key features include sales metrics, charts, order lists, and filters.
2. Product Analytics Dashboard
This dashboard monitors product performance, focusing on inventory levels and stock turnover. It tracks metrics like the fastest- and slowest-moving products, product charts, and detailed product lists, helping businesses manage inventory efficiently.
3. Customer Analytics Dashboard
A customer-focused dashboard offers detailed insights into customer behavior, preferences, and buying patterns. It reveals trends that can increase sales and improve marketing efforts. Key metrics include unique purchasers, lifetime value, top customers, and returning customer counts.
4. Marketing Performance Dashboard
Designed to assess the success of marketing campaigns, this dashboard tracks conversion rates, ROI, lead generation, and acquisition costs. By analyzing sales volume, revenue, and website metrics, businesses can refine campaigns for better results.
5. Project Management Analytics Dashboard
Ideal for tracking project-specific data, this analytics dashboard helps departments monitor project performance, highlighting transparency and improving collaboration. It displays project metrics, past performance data, and insights on campaign effectiveness.
6. Web Analytics Dashboard
This web analytics dashboard summarizes how users interact with your website, helping to track traffic sources, user behavior, and site performance. It enables businesses to optimize their online presence, enhance user experience, and improve engagement and conversions.
7. Business Analytics Dashboard
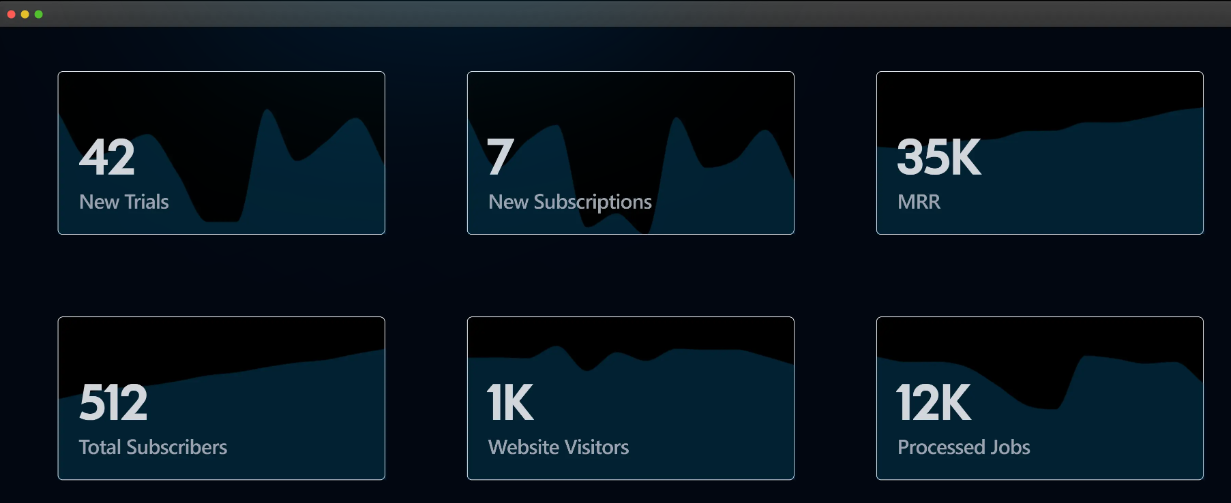
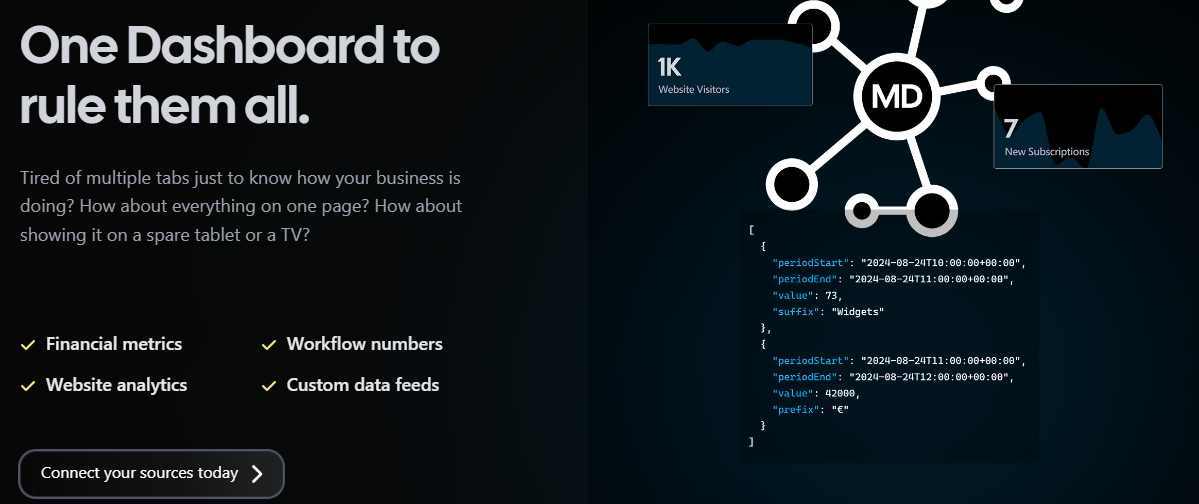
Minimal Dashboard is a business analytics dashboard designed to consolidate key business metrics —such as financials, website analytics, workflow statistics, and custom data feeds—into a single, real-time dashboard. It simplifies the process of tracking and evaluating a business’s performance across various departments.

With integrations like Stripe, Fathom Analytics, Helpscout, and Klaviyo, it ensures that all crucial metrics are available at a glance. This type of dashboard is perfect for teams looking for instant visibility into their operations, enabling smarter, data-driven decisions.
Factors To Consider When Choosing an Analytics Dashboard
1. Goal Alignment
Define your specific objectives: Whether it’s tracking website traffic, analyzing customer behavior, or assessing marketing performance, ensuring that the tool aligns with your goals is crucial for maximizing its effectiveness.
2. Real-Time Visibility and Alerts
Immediate access: The dashboard should provide immediate access to key performance metrics and automatically trigger alerts for unusual spikes or dips in data. This enables teams to quickly spot issues or opportunities and respond promptly.
Minimal Dashboard excels in this area, delivering real-time visibility that allows teams to monitor performance continuously. For example, if a sudden drop in website traffic is detected, Minimal Dashboard can send an instant alert to the marketing team, prompting them to investigate the cause—whether it’s a technical issue or a change in user behavior.
3. Automated Daily Reports
Automatic report generation: When selecting an analytics dashboard, it’s essential to find a tool that automatically generates daily reports, compiling the latest metrics and trends. This feature eliminates the need for manual data collection and ensures that decision-makers remain updated without requiring constant oversight.
For example, a sales team might rely on automated daily reports to track their lead generation efforts. Each morning, they receive a summary of new leads, conversion rates, and overall sales performance from the previous day.
4. Historical Data Tracking
Tracking historical data: The dashboard should allow for the tracking of historical data, capturing snapshots of key metrics over time. This capability enables businesses to understand long-term trends and evaluate the effectiveness of past strategies.
Minimal Dashboard’s ability to display historical data empowers users to analyze business performance trends over time. For instance, a sales team can review sales figures from previous quarters alongside current data, allowing them to identify seasonal patterns, assess the impact of past marketing campaigns, and make data-driven forecasts for future sales.
5. Trend Forecasting
Predictive capabilities: Predictive capabilities are a valuable feature, enabling businesses to forecast future trends and simulate different scenarios. This allows organizations to explore “what if” situations and prepare for potential outcomes.
For example, a retail business might use trend forecasting to estimate how a seasonal promotion could impact sales based on past performance, helping them optimize inventory and marketing efforts.
6. Customization and User Experience
Customization options: Ensure the dashboard offers robust customization options, allowing users to select metrics and visualizations relevant to their roles. An intuitive, user-friendly interface enhances accessibility for all team members.
Minimal Dashboard stands out with its user-friendly design and customization features, making it accessible for users of all technical backgrounds.
7. Integration Capabilities
Seamless integration: Evaluate the tool’s ability to integrate seamlessly with existing systems, such as CRM or ERP software. Effective integration streamlines data analysis and reduces manual data entry.
Minimal Dashboard stands out by supporting a wide range of integrations with common business tools, such as Stripe for payment processing and Helpscout for customer support. This capability compiles data from various sources and displays it on a single dashboard, providing a comprehensive view of business performance.
8. Scalability
Consider scalability: When evaluating an analytics dashboard, it’s essential to consider its scalability to ensure it can adapt to your organization’s evolving needs. A scalable dashboard should efficiently manage increasing data volumes, whether due to business growth, expanding product lines, or a surge in user engagement.
This adaptability is crucial for maintaining optimal performance, as a system that struggles under heavy data loads can lead to slow processing times and hinder decision-making.
Streamline Your Business Analytics with Minimal Dashboard
Choosing the right analytics dashboard empowers organizations to make informed, data-driven decisions that foster long-term success. If you’re in search of an all-in-one solution, Minimal Dashboard truly stands out. It delivers instant visibility into all your business operations from a single, user-friendly dashboard.
Whether you need to track key performance indicators (KPIs), monitor unexpected shifts, or review historical metrics, Minimal Dashboard streamlines the entire process, making it the ideal tool to drive your business forward.
