What we cover in this article
Discover the top 10 business dashboard software solutions to centralize your data and gain real-time insights. From Minimal Dashboard's streamlined metrics to Tableau's advanced analytics, these tools empower smarter, data-driven decisions. Simplify your data tracking and enhance performance with customizable, user-friendly dashboards tailored to your business needs.
Contents
- Introduction
- Why Listen to Us?
- What is Business Dashboard Software?
- 10 Best Business Dashboard Software
- Minimal Dashboard - Your Go-To Business Dashboard Software
Introduction
Keeping track of business performance can be overwhelming when your data is scattered across multiple tools and systems.
A reliable business dashboard software can bring all your key metrics into one centralized platform, giving you real-time insights to make smarter, data-driven decisions.
In this Minimal Dashboard article, we’ll review the 10 best business dashboard software options available today.
But first…
Why Listen to Us?
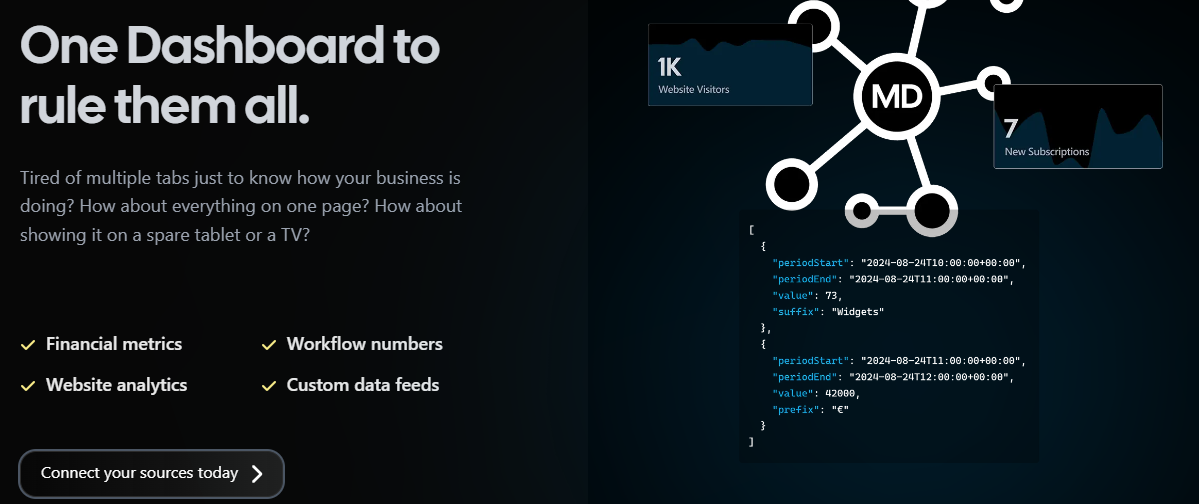
At Minimal Dashboard, we simplify the process of monitoring business metrics by offering a real-time, customizable dashboard that consolidates all your key data in one place. With our expertise, you can focus on making informed, data-driven decisions for your organization.
What is Business Dashboard Software?
Business dashboard software are digital tools designed to consolidate and display critical business data in an easily digestible format. They allow you to visualize key metrics, track performance indicators, and make data-driven decisions, all from a centralized, customizable interface.
Think of them as command centers that pull data from various sources—such as sales, marketing, finance, and operations—and present it in charts, graphs, and tables.
These dashboards provide real-time insights into the health of your business. With features like data visualization tools, KPI tracking, and performance metrics, they transform complex data sets into simple visuals.
10 Best Business Dashboard Software
Below are the tools we’ll be covering:
- Minimal Dashboard
- ClickUp
- Tableau
- Microsoft Power BI
- Zoho Analytics
- Domo
- ThoughtSpot
- Geckoboard
- Databox
- Klips by Klipfolio
1. Minimal Dashboard
Minimal Dashboard offers a new approach to business dashboard software, designed to centralize and simplify tracking key metrics. It provides instant visibility into your business’s performance by integrating data from various sources into one clean, customizable dashboard.
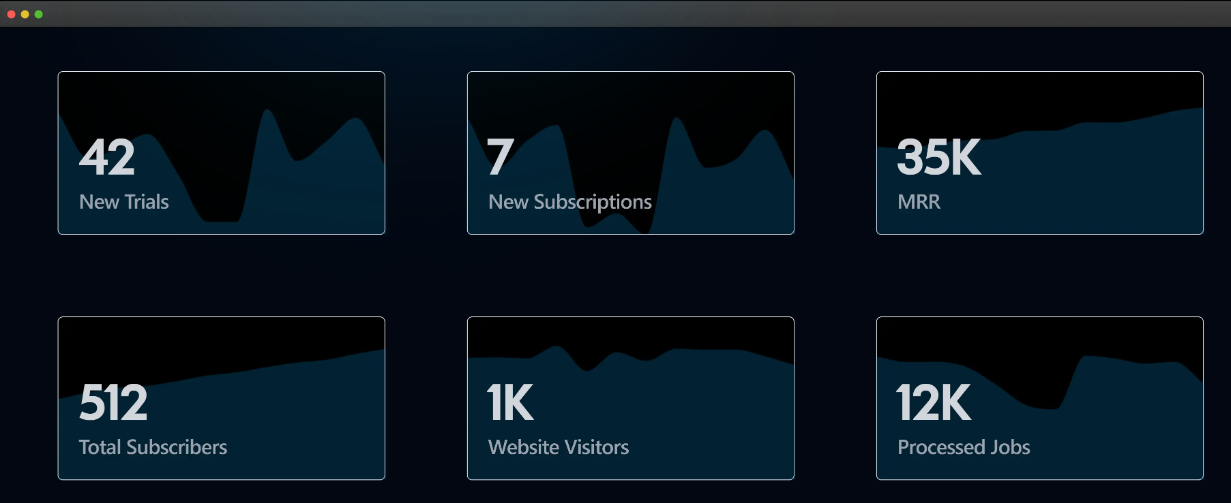
Built to help you focus on what matters, Minimal Dashboard is ideal for founders and small teams looking for actionable insights without the fuss of complex tools.
Key Features
- Centralized Metrics: Combine all your essential business metrics from different sources in a single, easy-to-navigate dashboard for a quick daily overview.
- Automated Reports: Schedule daily, weekly, or monthly reports delivered directly to your inbox to keep you informed on the latest trends.
- Real-time Alerts: Get instant notifications when unexpected events occur, such as traffic spikes or increased customer support loads, so you can take action promptly.
- Historical Data Analysis: Automatically capture snapshots of your key metrics over time and easily visualize trends to understand your business’s journey.
- Scenario Planning: Use built-in tools to model various business scenarios, comparing forecasts to guide decision-making for future growth.
- Business Event Journal: Document key events, such as product launches or pricing changes, and link them to specific metrics, offering valuable context for your data.
- Custom Integrations: Seamlessly connect with popular business tools for traffic, payments, marketing, and operations. More integrations are regularly added to support your data sources.
Pricing
- Free Trial: Available for all plans, allowing users to find the best fit for their needs.
- Solo Plan: $9/month for individuals (1 dashboard, 10 metrics, 1 user).
- Startup Plan: $29/month for teams (5 dashboards, 30 metrics, 5 users).
- Business Plan: $79/month for data-driven companies (20 dashboards, 100 metrics, 50 users).
Pros
- Clean, easy-to-use dashboard tailored for small teams and founders
- Automated daily reports and alerts provide actionable, real-time insights
- Supports scenario planning to forecast future business performance
- Customizable and integrates with a wide range of tools
Cons
- Limited to predefined integrations, with new connections being rolled out over time
2. ClickUp
ClickUp is an all-in-one business dashboard software designed to help teams streamline their work and boost productivity. Its customizable dashboards provide a clear view of tasks, goals, and key metrics across departments.
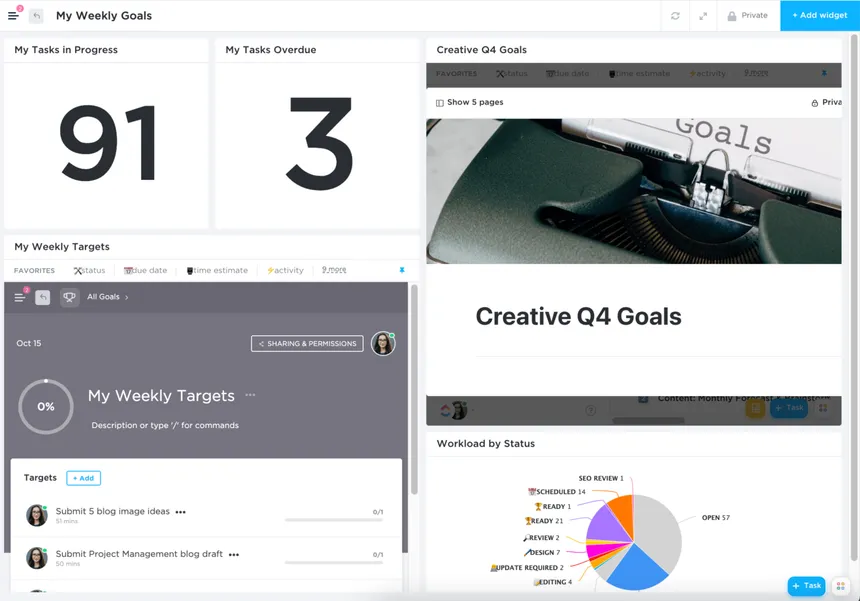
With ClickUp, you can easily track project progress, visualize data in various formats, and collaborate effectively. The platform’s flexible and user-friendly interface makes it ideal for businesses of all sizes.
Key Features
- Custom Widgets: Add and arrange widgets to create personalized dashboards for tracking tasks, time, sprints, goals, and more.
- Multiple Data Views: Visualize data through lists, boards, calendars, timelines, and Gantt charts to suit different project management styles.
- Real-Time Reporting: Monitor progress, team performance, and workloads in real-time to keep projects on track.
- Automated Workflows: Use automation to streamline repetitive tasks, reducing manual effort and improving productivity.
Pricing
- A free Forever plan
- An unlimited plan at $7 per user per month (billed annually)
- The business plan at $12 per user per month (billed annually)
Pros
- Highly customizable dashboard layouts
- Wide range of data visualization tools
- Comprehensive project management features
- Offers a generous free plan
Cons
- Occasional bugs that significantly impact user experience
- Customer support can be slow and unresponsive
3. Tableau
Acquired by Salesforce in 2019, Tableau is an AI-powered business intelligence and analytics software. It allows businesses to transform raw data into meaningful insights using interactive dashboards and charts.
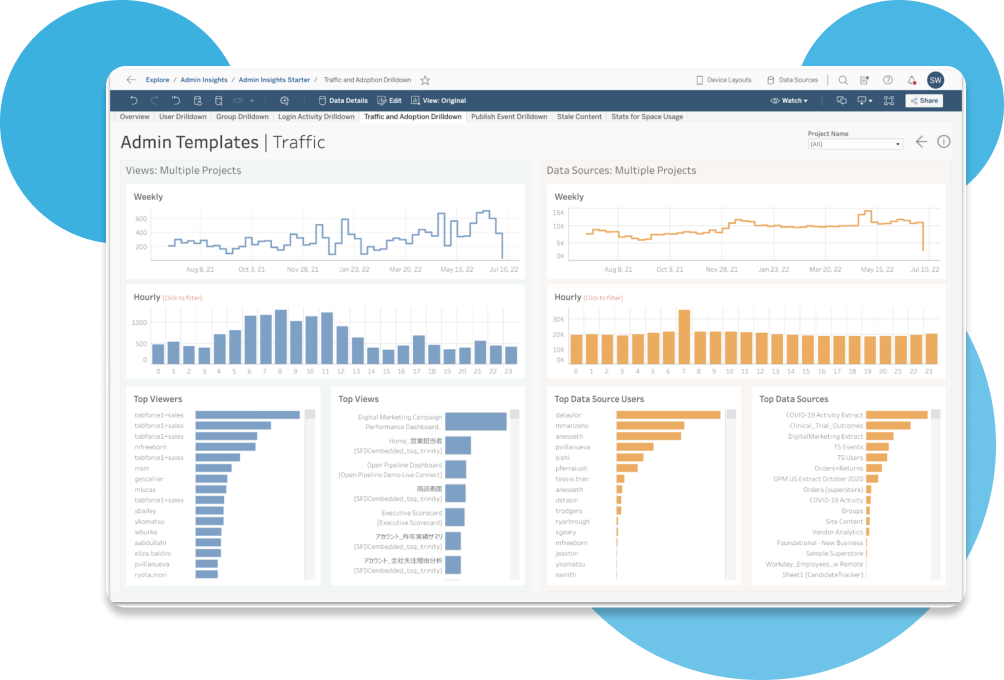
Tableau supports integration with various data sources, making it suitable for companies looking to analyze complex datasets in real-time. Its flexibility and depth make it popular among data-driven organizations.
Key Features
- Interactive Visualizations: Create dynamic and interactive charts, graphs, and dashboards that update with real-time data.
- Data Integration: Connect with multiple data sources, including cloud services, databases, and spreadsheets, for seamless data analysis.
- Customizable Dashboards: Tailor dashboards to match your business needs and highlight essential KPIs.
- Advanced Analytics: Utilize built-in analytics functions for forecasting, trend analysis, and data exploration.
Pricing
- Free Trial: Available
- Tableau Viewer: $15/user/month for dashboard creation and interaction.
- Tableau Explorer: $42/user/month for data exploration, visualization, and full-service analytics.
- Tableau Creator: $75/user/month for full feature access, including data preparation, management, and insights.
Pros
- Offers advanced data visualization options
- Integrates with a wide range of data sources
- Highly customizable for different use cases
- Robust analytics and reporting tools
Cons
- May struggle with large-scale data analysis and reporting
- Using the advanced features may come with a steep learning curve
4. Microsoft Power BI
Microsoft Power BI is a comprehensive business dashboard solution that provides robust data analytics and visualization tools. It enables businesses to turn raw data into interactive insights using its drag-and-drop interface.
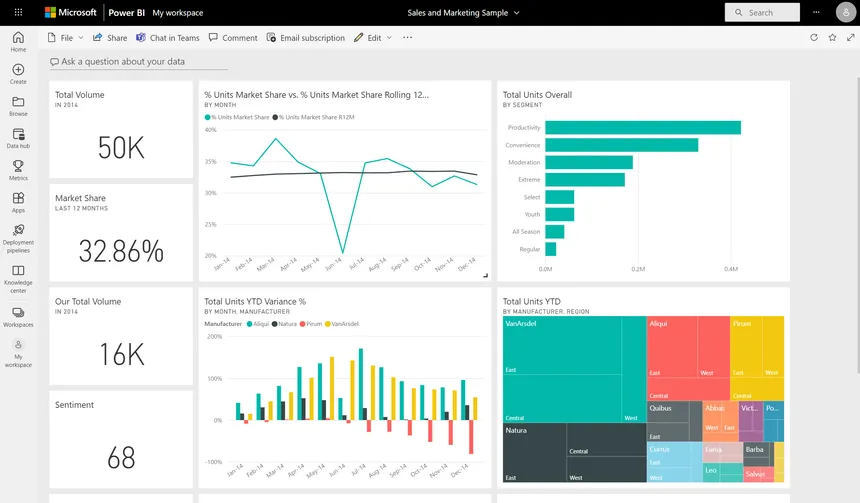
It integrates with multiple external and internal data sources and offers advanced data visualization capabilities, including maps, graphs, and interactive charts.
Key Features
- Customizable Dashboards: Create personalized dashboards using a range of visual elements like charts, maps, and tables.
- Data Integration: Integrate with a variety of data sources, including Excel, SQL Server, Azure, and more, for comprehensive analytics.
- Real-Time Data: Access real-time data to track KPIs, monitor trends, and make data-driven decisions.
- AI-Driven Insights: Utilize AI capabilities to detect patterns and gain deeper insights into your data.
Pricing
- Free Plan: Included in the Microsoft Fabric free account.
- Pro: $10/month/user for advanced features like publishing and sharing.
- Premium: $20/month/user for additional capabilities.
Pros
- Seamless integration with Microsoft products
- User-friendly interface with drag-and-drop features
- Extensive data source connectivity
- Advanced analytics powered by AI
Cons
- Limited customization in some visualizations
- Works best for users already in the Microsoft ecosystem
5. Zoho Analytics
Zoho Analytics is a self-service business intelligence tool designed for small to medium-sized businesses. It offers a range of data visualization and reporting tools to transform raw data into actionable insights.
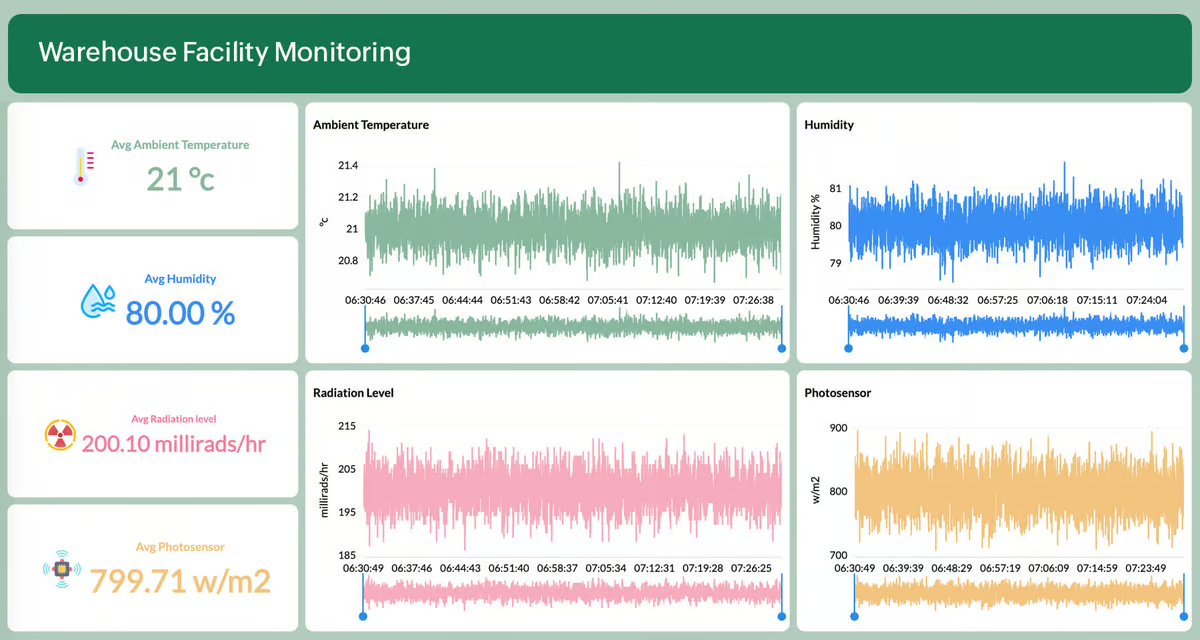
With its simple drag-and-drop interface, Zoho Analytics allows you to create custom dashboards that suit your business needs. Its cloud-based nature ensures easy access and collaboration for distributed teams.
Key Features
- Data Visualization: Create a variety of visual reports, including charts, tables, and maps, to display key metrics.
- Data Integration: Import data from multiple sources, such as spreadsheets, databases, and cloud services, for centralized analysis.
- Custom Dashboards: Design tailored dashboards that reflect your business’s unique KPIs and performance indicators.
- AI-Driven Analysis: Use Zia, Zoho’s AI-powered assistant, to gain insights and predictions from your data.
Pricing
- Free plan: Available
- Paid Plans: Starts at $22/month for 2 users (billed annually)
Pros
- Versatile as integrated applications cover various sectors
- Integrates with other Zoho products and third-party apps
- AI-driven insights for enhanced data analysis
- Interface can be customized to suit various needs
Cons
- Complex for users new to business dashboards
- Customer support can be slow and unresponsive
6. Domo
Domo is a cloud-based dashboard software designed for businesses looking to gain real-time insights into their operations. It offers a range of data visualization tools and customizable dashboards, enabling teams to track key metrics and make informed decisions.
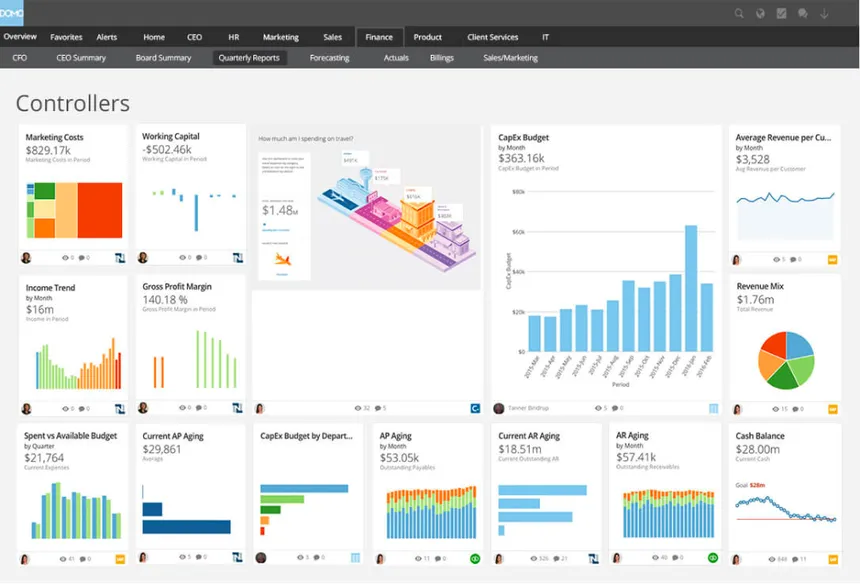
Domo’s integration capabilities allow you to connect data from various sources and access it on the go with its mobile app.
Key Features
- Real-Time Data: Access up-to-the-minute data on dashboards for quick decision-making.
- Customizable Dashboards: Build interactive and visually appealing dashboards tailored to your business needs.
- Data Integration: Connect to multiple data sources, including databases, spreadsheets, cloud services, and third-party applications.
- Mobile Access: Use the Domo mobile app to monitor dashboards and reports on the go.
Pricing
- Free Trial: Available
- Paid Plan: Not publicly listed; must contact sales team
Pros
- Customer care is helpful and responsive
- Wide range of data integration options
- Mobile-friendly for easy access
- User-friendly interface and intuitive design
Cons
- Dashboard visualizations sometimes are incorrect
- Limited themes and creative visuals lead to similar-looking apps
7. ThoughtSpot
ThoughtSpot is a next-generation business intelligence platform known for its search-driven analytics and AI-powered insights. This software enables users to create custom dashboards by simply searching for data, similar to how they would use a search engine.
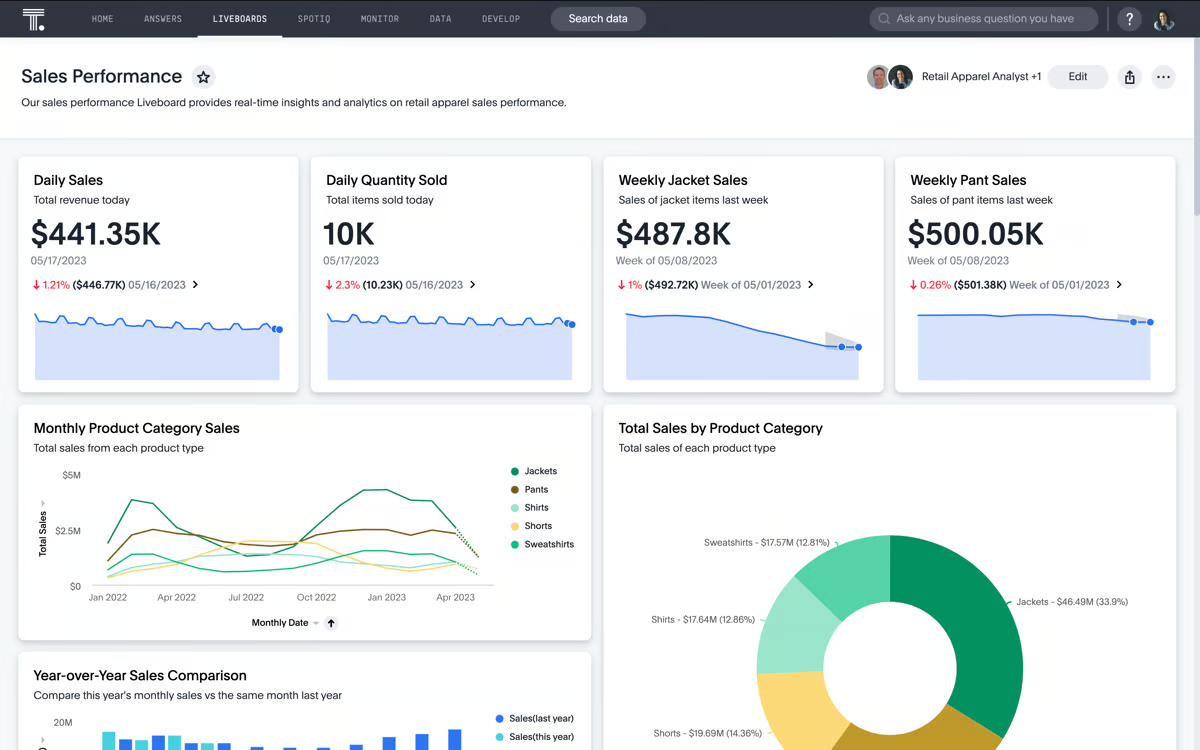
It’s ideal for businesses that need quick and accurate data analysis without relying heavily on data specialists.
Key Features
- Search-Driven Analytics: Search your data using natural language queries to create interactive dashboards and uncover insights quickly.
- AI-Driven Insights: Use AI-powered analytics to identify trends, anomalies, and correlations in your data.
- Customizable Dashboards: Design personalized dashboards with dynamic charts, graphs, and tables that update in real-time.
- Data Integration: Integrate with various data sources, including cloud services, databases, and spreadsheets, for comprehensive analysis.
Pricing
- Free Trial: available
- Paid Plans: Starts at $1250 /month, 20 users, billed annually
Pros
- Intuitive, search-based data exploration
- Powerful AI-driven analytics for deeper insights
- Highly customizable dashboards tailored to the needs of different businesses
- Extensive data integration capabilities
Cons
- Need to refresh to access most updated data
- Not easy to use as it requires a bit of coding
8. Geckoboard
Geckoboard is a user-friendly dashboard software designed for startups, small businesses, and teams that need a quick overview of their key metrics. It allows users to create and customize dashboards with drag-and-drop widgets, making data visualization accessible even for those with limited technical skills.
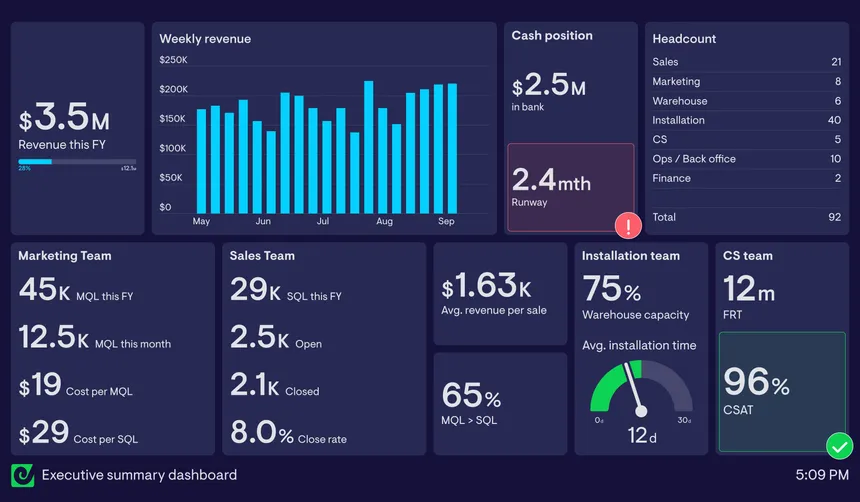
Geckoboard focuses on providing real-time insights, helping teams stay aligned with their performance goals.
Key Features
- Drag-and-Drop Interface: Build custom dashboards using a simple drag-and-drop editor with widgets for charts, graphs, and tables.
- Real-Time Data: Monitor your business’s performance in real-time, keeping your team updated on important metrics.
- Integration: Connect to popular tools like Google Analytics, Shopify, and Salesforce for centralized data tracking.
- Sharing Capabilities: Share dashboards with your team via secure links, emails, or display them on office screens.
Pricing
- Free Trial: Available
- Essentials: $39/mo (billed annually) - 1 dashboard, 3 users
- Pro: $159/mo (billed annually) - 3 dashboards, 5 users, over 90 data sources
- Scale: $559/mo (billed annually) - 30 dashboards, 25 users
Pros
- Easy to use with a drag-and-drop editor
- Real-time data tracking for up-to-date insights
- Extensive integration options
- Ideal for small businesses and startups
Cons
- Limited in advanced analytics features
- Customization options are basic compared to other platforms
9. Databox
Databox is a performance management platform that brings together data from multiple sources into one customizable dashboard. It’s designed for marketers, sales teams, and analysts looking for real-time insights without the need for coding skills.
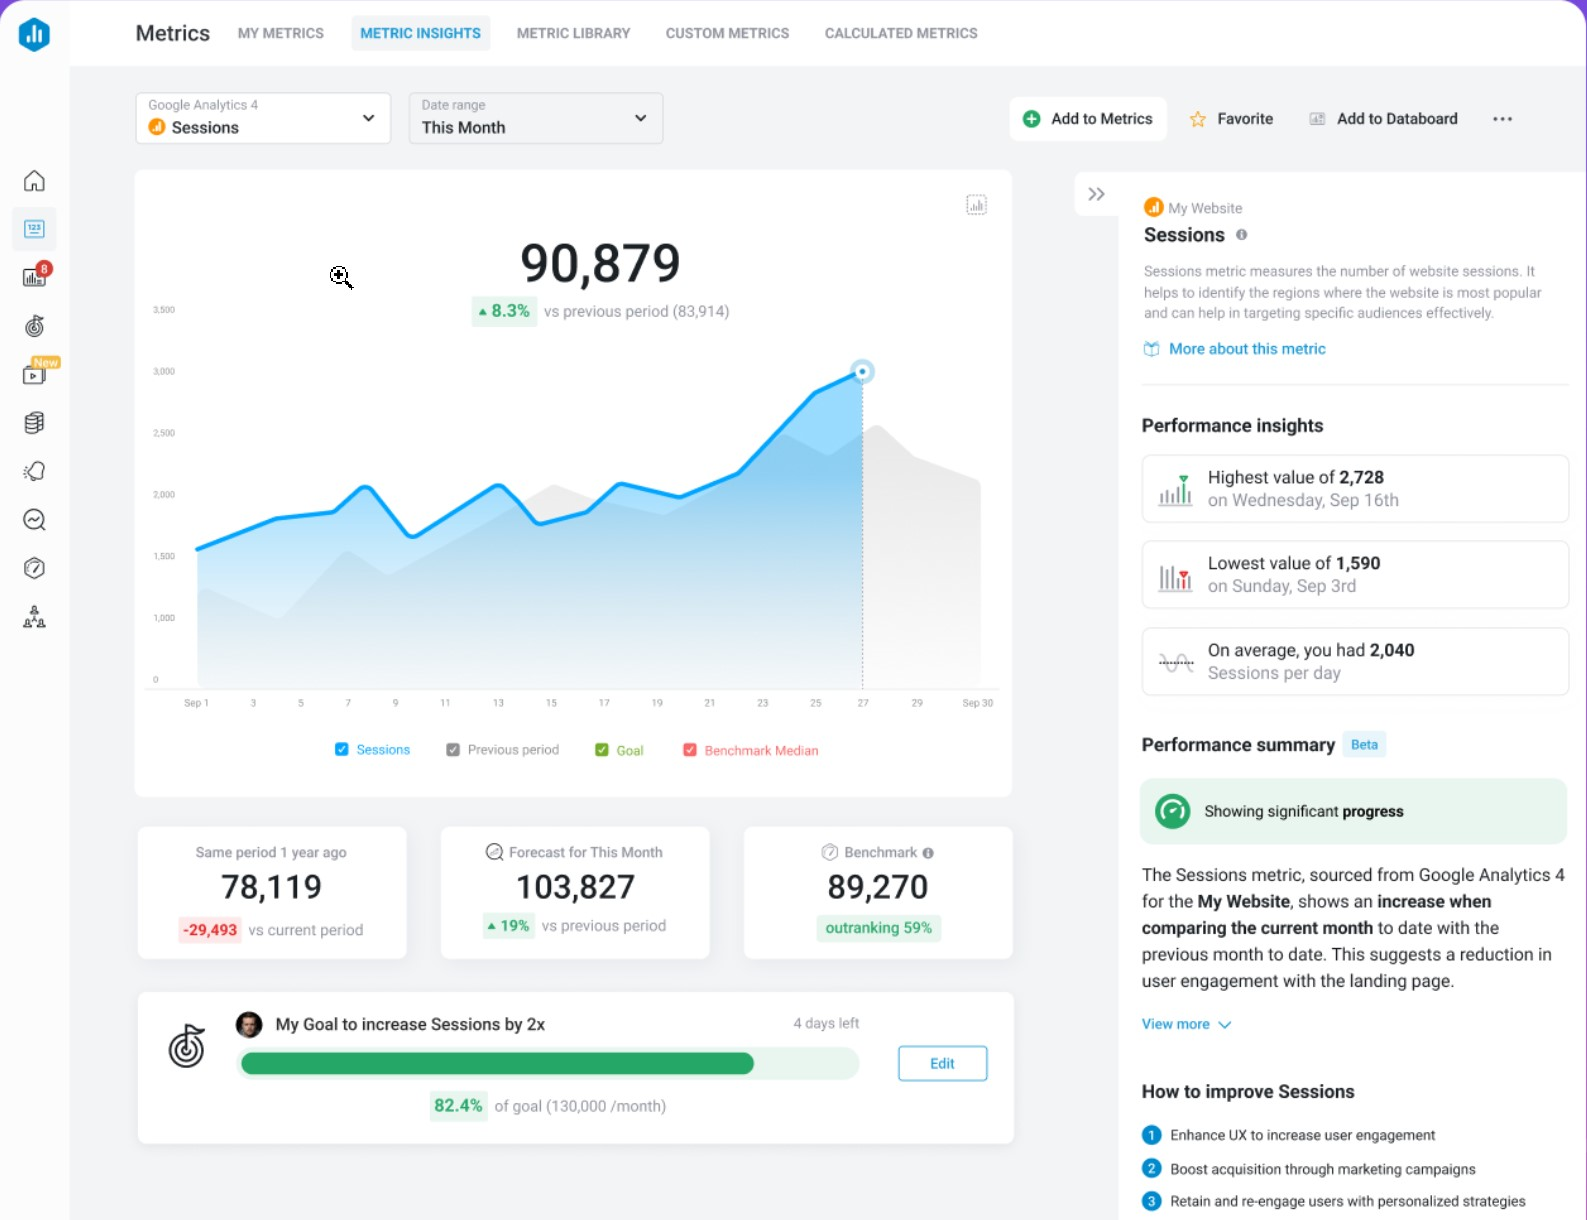
With its library of pre-built dashboard templates, Databox makes it easy to get started with tracking key business metrics.
Key Features
- Pre-Built Templates: Choose from a variety of pre-built dashboard templates for marketing, sales, and finance metrics to jumpstart your data tracking.
- Real-Time Data: Get up-to-the-minute data insights from sources like Google Analytics, HubSpot, and Salesforce.
- Score Cards for KPIs: Databox provides scorecards that visually track your business’s key performance indicators (KPIs) in one place. It supports thousands of pre-made metrics, and you can build your own.
- Mobile Access: Use the Databox mobile app to access dashboards and reports on the go.
Pricing
- Free Plan: Available, up to three data sources.
- Paid Plans: Starting at $47/month for advanced features
Pros
- Wide range of pre-built templates for easy setup
- Real-time data from various sources
- No coding skills required to customize dashboards
- Mobile-friendly for on-the-go access
Cons
- The initial setup is complex and may take time
- Data integration can be limited depending on the source
10. Klips by Klipfolio
Klips is a cloud-based business dashboard software designed to help companies track and visualize their KPIs. Its inbuilt data filters, segments, and dimensions help to process data for quick and actionable insights.
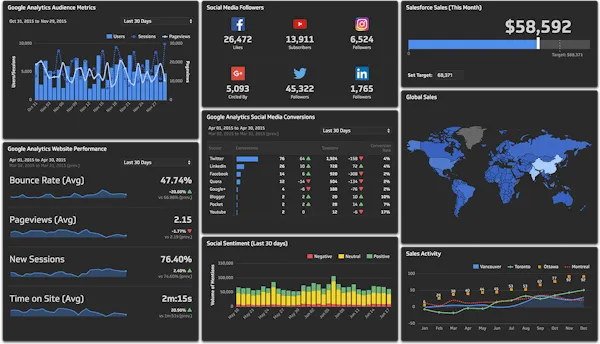
With its flexible interface, Klips enables users to design dynamic dashboards that fit their unique needs.
Key Features
- Klip Editor: Consolidate and simplify complex data into easy-to-understand visual dashboards using an extensive library of formulas and functions, filtering, grouping, and sorting.
- Automated Reporting: Convert dashboards, reports, and insights into shareable PDFs for a one-time or scheduled automated distribution to team members and stakeholders.
- Advanced Customization Features: Besides custom themes, Klips lets you customize your Klips using an HTML template component, along with inline CSS and Javascript.
- Implementation and Onboarding: For a quick start, Klips offers data stack integration and dashboard creation services. It also offers training plans to guide your team on how to maximize the platform and its tools.
Pricing
- Free Trial: Available for 14 days
- Grow: $170/month (billed annually) offers 15 dashboards and 1hr data refresh for unlimited users.
- Team: $310/month (billed annually) offers 30 dashboards, 15-minute data refresh, and advanced customization
- Team Plus: $600/month (billed annually) offers 60 dashboards, instant data refresh, and 1:1 onboarding
Pros
- Extensive integration with various data sources
- Highly customizable dashboard design
- Offers real-time data tracking and reporting
- Suitable for small businesses and large enterprises alike
Cons
- Advanced customization can be complex for users new to business dashboards
- Larger datasets can lead to a lag in performance
Minimal Dashboard - Your Go-To Business Dashboard Software
Business dashboard software is essential for turning complex data into actionable insights, helping companies of all sizes make informed, data-driven decisions.
Among the options we’ve listed, Minimal Dashboard stands out as the ideal choice for founders and small teams. It offers customizable dashboards that seamlessly integrate with your existing tool stack, providing a streamlined experience for capturing relevant business data.
Ready to simplify your business data tracking? Try Minimal Dashboard for free today!
