What we cover in this article
Unlock streamlined business metrics with Minimal Dashboard's six examples, designed to consolidate KPIs into a single view. Enhance decision-making and boost revenue with real-time insights, centralized data, and customizable features, empowering your organization to optimize strategies across sales, marketing, finance, and operations. Try it for free today!
Contents
- Introduction
- Why Listen to Us?
- What is a Business Dashboard?
- Main Benefits of a Business Dashboard
- 6 Business Dashboard Examples
- Streamline Your Business Metrics with Minimal Dashboard
Introduction
Many companies struggle to maximize revenue due to fragmented information across departments. Sales teams often lack real-time insights into performance metrics, while marketing departments face challenges in measuring campaign effectiveness.
To overcome these challenges, businesses require tools that consolidate key performance indicators (KPIs) into a single view.
This Minimal Dashboard article presents six dashboard examples to enhance visibility and provide actionable insights, ultimately driving better revenue performance.
Why Listen to Us?
At Minimal Dashboard, we simplify the process of monitoring business metrics by offering a real-time, customizable dashboard that consolidates all your key data in one place. With our expertise, you can focus on making informed, data-driven decisions for your organization.
What is a Business Dashboard?
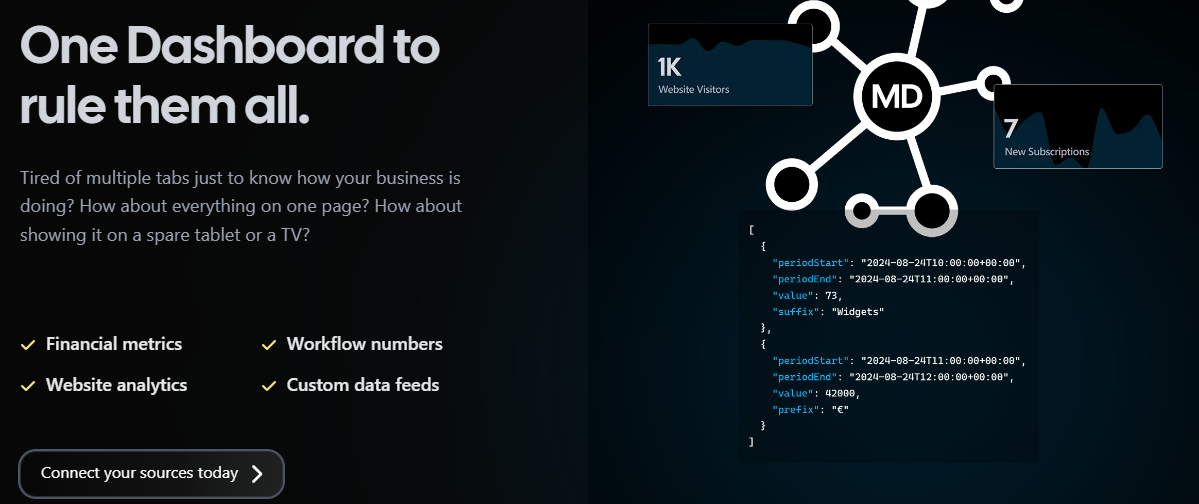
A dashboard is a visual interface that consolidates key business metrics and data points, allowing organizations to monitor performance, track progress, and assess real-time status. Dashboards are essential tools across industries, enabling teams to quickly grasp critical insights without navigating through complex data sets.
By aggregating information from various sources, dashboards present data in user-friendly formats; such as charts, graphs, and indicators—making it easier for decision-makers to identify trends, optimize strategies, and drive business growth.
Main Benefits of a Business Dashboard
1. Centralized Information
Business dashboards aggregate data from various sources into a single visual display, eliminating the need to switch between multiple platforms and streamlining data access.
2. Real-Time Data Monitoring
Dashboards provide real-time or near-real-time insights, enabling teams to track key performance indicators (KPIs) and metrics as they unfold, which supports timely decision-making.
3. Enhanced Decision-Making
By presenting data in clear and intuitive charts and graphs, dashboards allow users to quickly identify trends, patterns, and issues, empowering informed strategic choices.
4. Improved Efficiency
Automation of data collection and reporting processes reduces the time spent on manual compilation, allowing teams to focus on analysis and action rather than data gathering.
5. Customizability
Many dashboards offer customizable features, enabling users to prioritize and display the metrics that are most relevant to their specific business needs and objectives.
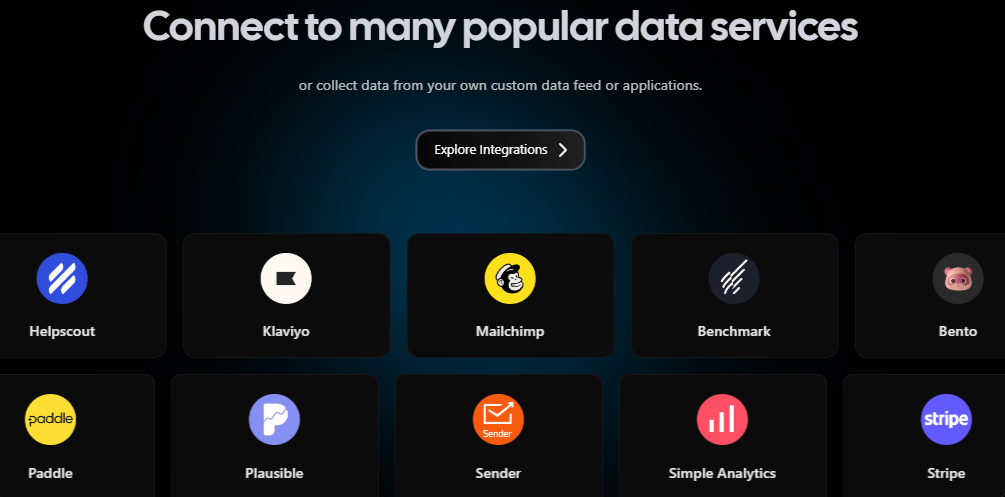
Minimal Dashboard effectively embodies these benefits, providing all your key metrics in one simple interface. With seamless integration of popular data services and custom feeds, you can stay informed, uncover trends, and evaluate the impact of your business decisions.
6 Business Dashboard Examples
1. Sales Dashboard
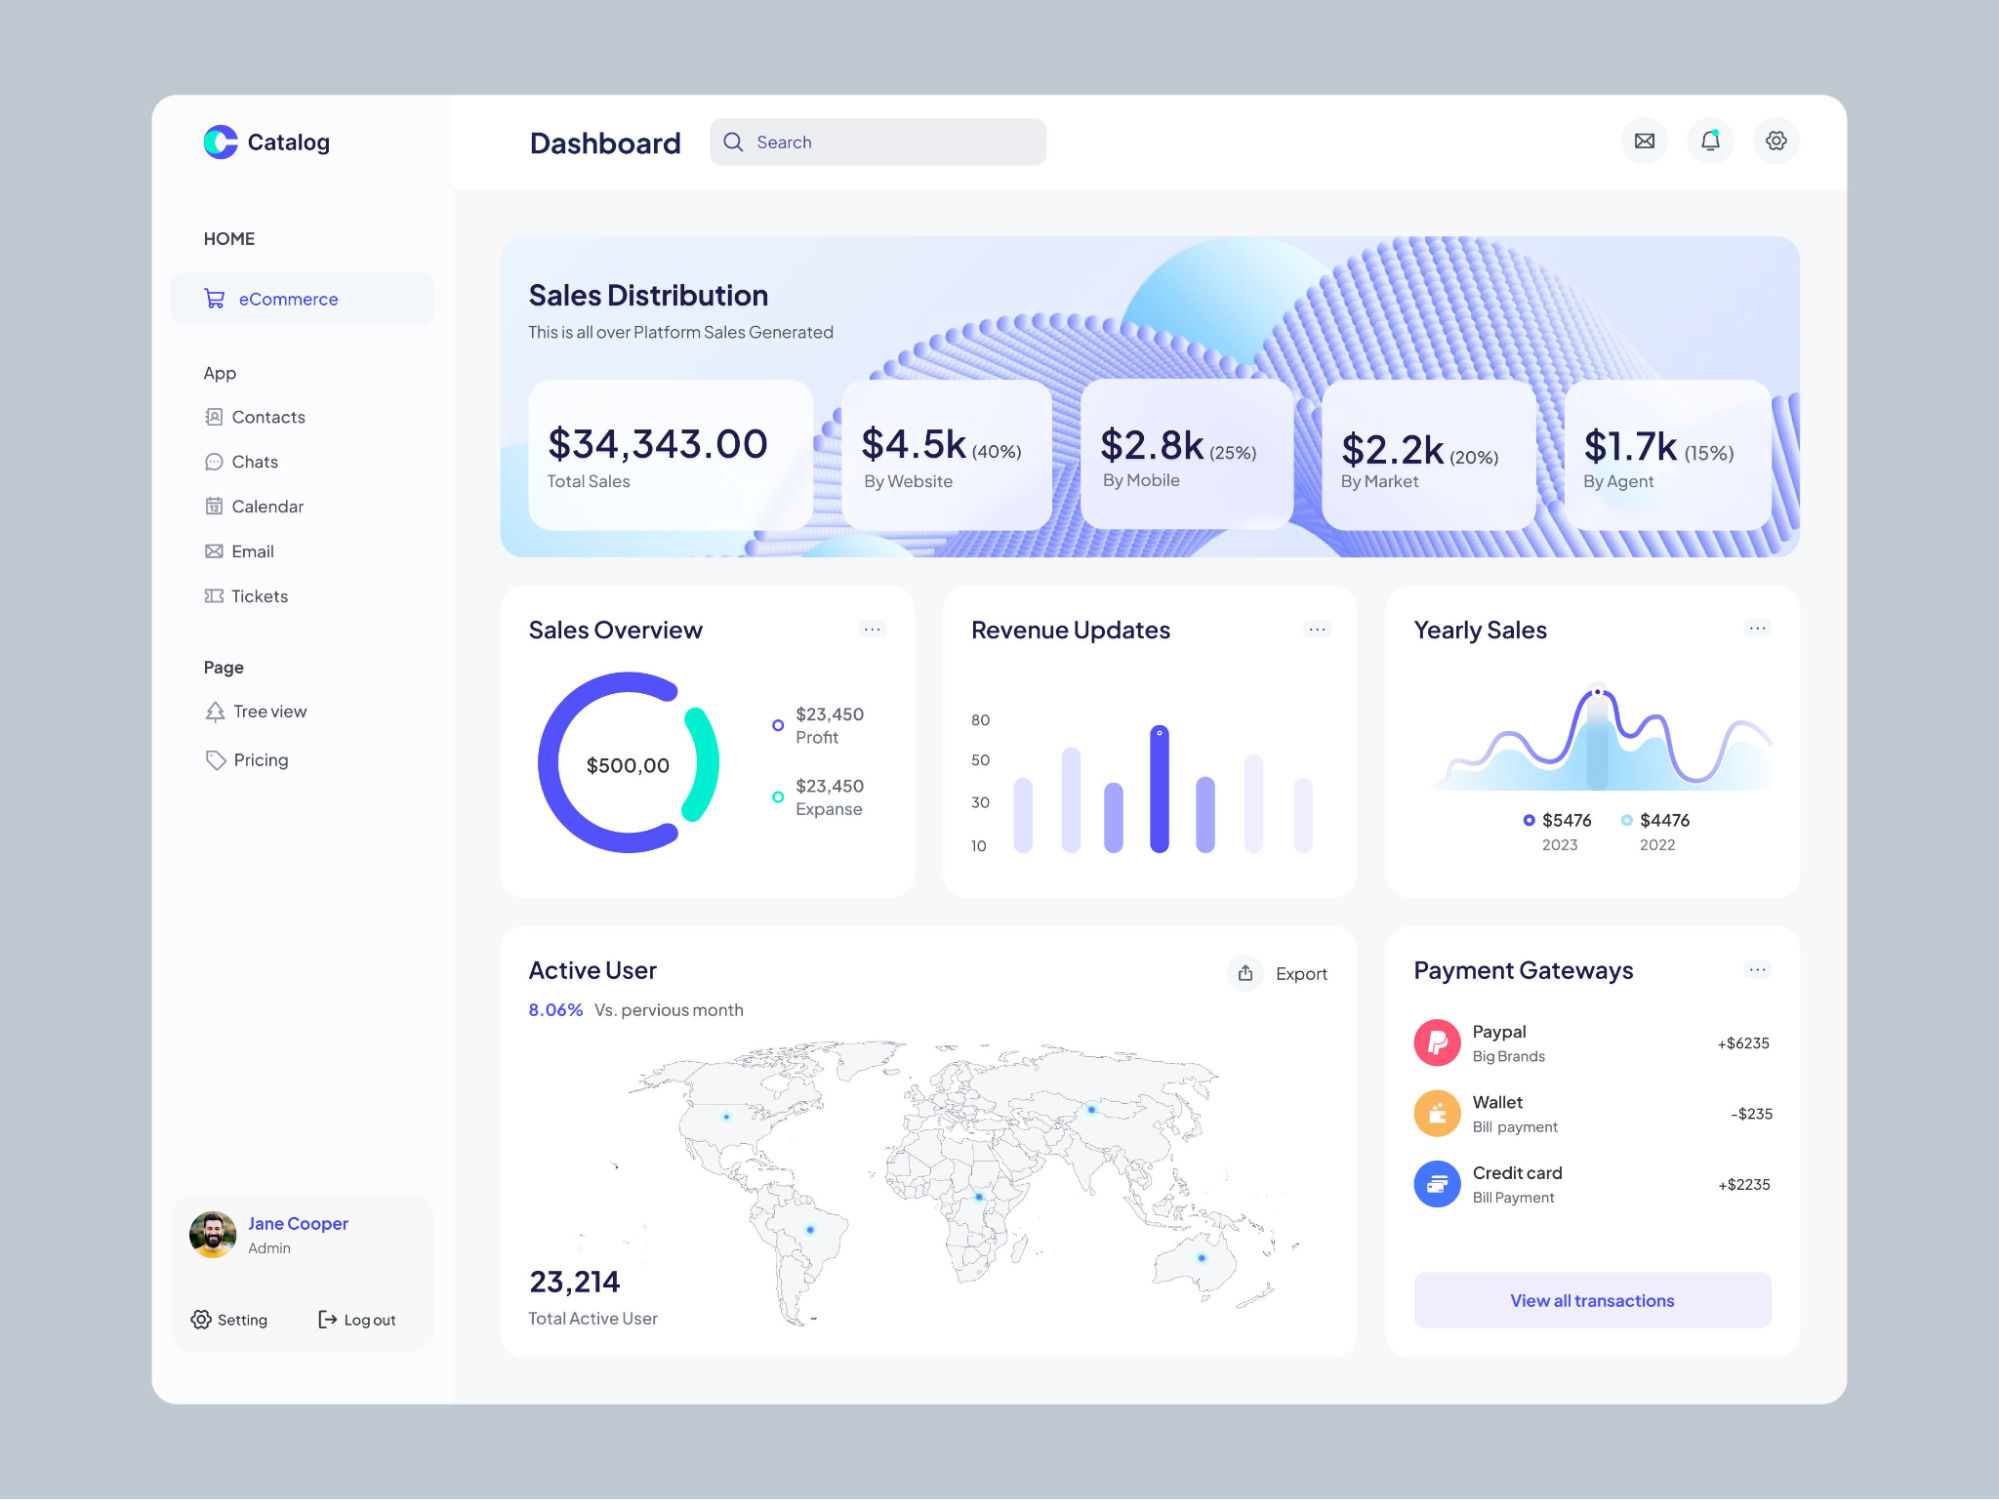
A sales dashboard is a tool that consolidates and visualizes key sales performance data in real time. It helps sales teams, managers, and executives monitor and analyze critical sales metrics, track progress toward targets, and make informed decisions based on data. Sales dashboards are highly customizable, allowing users to prioritize the metrics most relevant to their goals.
Key Elements
- Sales KPIs: Displays essential sales performance indicators like revenue, sales targets, and conversion rates.
- Sales Pipeline Overview: Visualizes the stages of the sales pipeline, showing where each deal is in the process.
- Sales Performance by Rep: Provides insights into the performance of individual sales team members, highlighting strengths and areas for improvement.
- Sales Forecasting: Helps predict future sales performance based on historical data, trends, and current pipeline.
- Regional Sales Performance: Breaks down sales data by geography, helping businesses analyze performance in different regions.
Real Business Use Case
- Identifying Top Performers: A retail company uses the sales dashboard to highlight top-performing sales representatives, enabling them to recognize and reward high achievers, fostering a culture of excellence.
- Adjusting Strategies: A SaaS business leverages the dashboard to track conversion rates across different sales channels, allowing them to quickly pivot marketing strategies based on real-time data.
- Regional Performance Analysis: An automotive dealer utilizes regional sales insights to allocate resources effectively, ensuring that underperforming areas receive the necessary support and training to improve sales outcomes.
2. Marketing Dashboard
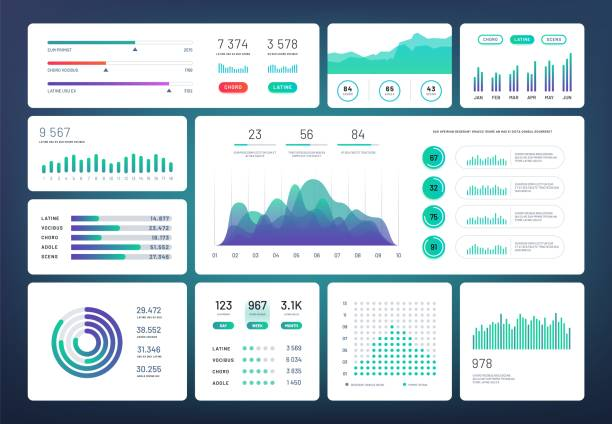
A marketing dashboard is a tool that aggregates and visualizes key marketing metrics and KPIs in a single interface, helping teams track, analyze, and optimize their marketing performance across different channels.
It provides real-time insights into campaign effectiveness, audience engagement, and overall marketing ROI, empowering marketers to make data-driven decisions that can enhance strategies and boost results.
Key Elements
- Campaign Performance Tracking: Visualizes the success of marketing campaigns, such as email campaigns, social media ads, PPC (pay-per-click), or SEO efforts.
- Social Media Analytics: Measures social media performance across platforms like Facebook, Twitter, Instagram, and LinkedIn. Tracks followers, engagement rates, reach, and impressions.
- SEO Performance Metrics: Displays search engine optimization (SEO) metrics such as keyword rankings, backlinks, organic traffic, and page authority.
- ROI and Budget Tracking: Measures marketing spend against campaign performance to determine ROI for each channel.
- Customer Journey and Conversion Tracking: Maps out how prospects move through the marketing funnel, from awareness to conversion.
Real Business Use Case
- Optimizing Ad Spend: A digital marketing agency utilizes the marketing dashboard to analyze the ROI of various ad campaigns, allowing them to reallocate budget toward the most effective channels, thereby maximizing returns.
- Improving Customer Engagement: An eCommerce brand tracks engagement metrics across social media and email campaigns, using insights to refine their content strategy and improve audience interactions.
- Assessing Lead Quality: A B2B company leverages lead generation metrics to evaluate which marketing channels produce the highest quality leads, enabling them to focus resources on the most effective tactics for nurturing prospects.
3. Financial Dashboard
A financial dashboard is a critical tool that provides a comprehensive view of an organization’s financial health in real time. It aggregates key financial metrics and data, allowing stakeholders to monitor performance, manage budgets, and make informed financial decisions.
Financial dashboards are essential for CFOs, finance teams, and business owners to maintain control over financial operations and drive strategic growth.
Key Elements
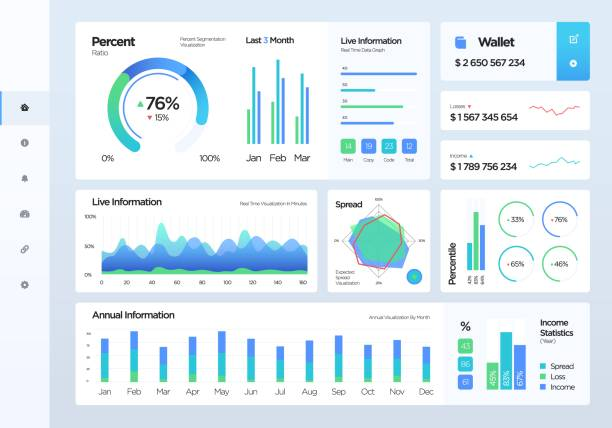
- Revenue Overview: Displays total revenue, including comparisons to previous periods and forecasts for future earnings.
- Expense Tracking: Visualizes operational costs, categorizing them by type (fixed, variable) and comparing them against budgeted amounts.
- Profit Margins: Provides insights into gross, operating, and net profit margins, helping to assess overall profitability.
- Cash Flow Analysis: Monitors inflows and outflows of cash, ensuring that the business maintains adequate liquidity for operations.
- Budget vs. Actuals: Compares actual financial performance against the budget, identifying variances and potential areas for cost-saving.
Real Business Use Case
- Budget Management: A manufacturing firm uses a financial dashboard to compare actual expenses against budget forecasts, allowing them to identify areas where they can cut costs and improve efficiency.
- Cash Flow Optimization: A small business tracks cash inflows and outflows through the dashboard, enabling them to make timely decisions about reinvesting profits and managing operational expenses.
- Investment Analysis: A startup leverages the financial dashboard to monitor revenue growth and profitability, helping attract potential investors by showcasing a clear financial trajectory.
4. Website Analytics Dashboard
A website analytics dashboard is an essential tool that provides insights into the performance and user behavior on a website. By aggregating data from various web analytics tools, this dashboard helps businesses understand how visitors interact with their site, allowing them to optimize user experience, improve engagement, and drive conversions.
Key Elements
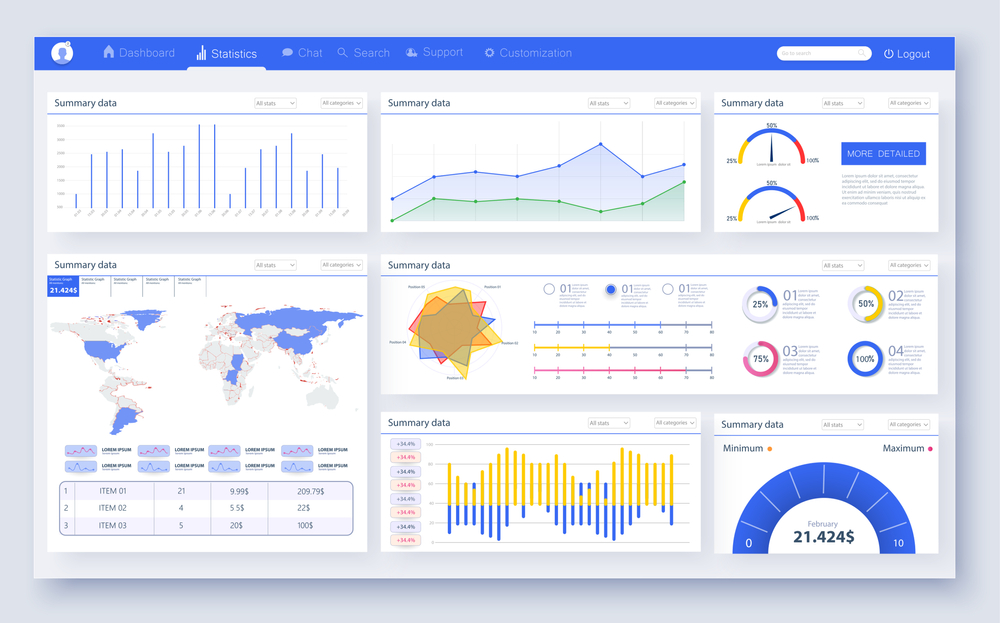
- Visitor Overview: Displays total visitors, unique visitors, and returning visitors to gauge overall traffic trends.
- Traffic Sources: Breaks down how visitors arrive at the site, including organic search, direct traffic, referral traffic, and social media.
- User Engagement Metrics: Measures key engagement metrics such as average session duration, bounce rate, and pages per session to evaluate user interaction.
- Demographics and Geography: Provides insights into visitor demographics (age, gender) and geographic locations, helping tailor content and marketing strategies.
- Device and Browser Usage: Analyzes the types of devices (desktop, mobile, tablet) and browsers used to access the site, informing design and functionality decisions.
Real Business Use Case
- Content Optimization: An e-commerce website utilizes its analytics dashboard to identify high-traffic pages with high bounce rates, allowing them to improve content and enhance user engagement.
- Marketing Strategy: A SaaS company analyzes traffic sources to determine which channels drive the most conversions, enabling them to allocate marketing budget more effectively.
- User Experience Improvement: A blog monitors user demographics and device usage through the dashboard, leading to the optimization of the site layout for mobile users, ultimately increasing readership and engagement.
5. Customer Support Management Dashboard
A customer support management dashboard is a centralized tool used to monitor and analyze the performance of customer service teams, providing real-time insights into key support metrics, such as ticket volume, response times, resolution rates, and customer satisfaction.
It helps businesses optimize their support operations, track team productivity, and ensure that customer issues are resolved efficiently and effectively.
Key Elements
- Ticket Volume: Tracks the number of customer support tickets submitted over a given period, showing the flow of incoming support requests.
- First Response Time (FRT): Measures how quickly the support team responds to the initial customer inquiry.
- Resolution Time: Displays the time taken to fully resolve customer issues from the moment a ticket is created.
- Customer Satisfaction (CSAT): Tracks feedback collected from customers after their issue has been resolved, typically via surveys.
- Ticket Backlog: Shows the number of open or unresolved tickets, allowing managers to identify whether the support team is keeping up with demand.
- Agent Performance Metrics: Provides insights into individual agent performance, tracking metrics such as tickets resolved, response time, and customer feedback.
Real Business Use Case
- Service Level Improvement: A tech support company uses its customer support dashboard to analyze FRT and resolution times, enabling them to identify areas needing additional training and resources, ultimately improving service levels.
- Customer Feedback Integration: A SaaS company leverages CSAT data from the dashboard to identify common pain points among customers, driving improvements in their product features and support documentation.
6. Business Operations Dashboard
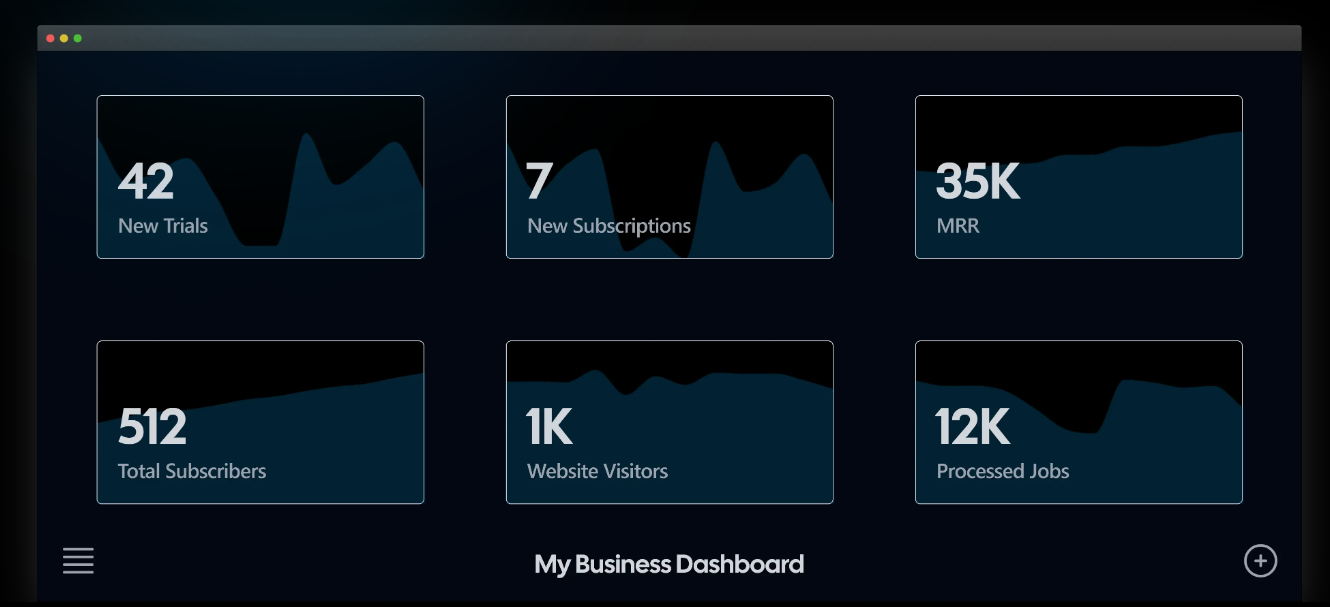
Business Operations dashboard, like Minimal Dashboard, consolidates key data and metrics across various functions (sales, marketing, operations, customer support, etc.) into a single, unified interface.
These dashboards are designed to provide an at-a-glance view of a business’s overall performance, simplifying decision-making and improving operational efficiency by presenting data from different sources in one place.
Key Elements
- Overall Performance Metrics: Displays aggregated performance indicators across all departments, allowing leaders to assess the health of the business at a glance.
- Departmental KPIs: Breaks down metrics by department (e.g., sales targets, marketing ROI, customer support resolution times), facilitating cross-functional analysis.
- Trend Analysis: Provides visualizations of trends over time, helping businesses spot seasonal patterns or long-term shifts in performance.
- Resource Allocation: Tracks resource usage and allocation across departments, allowing management to optimize budgets and staffing.
- Operational Bottlenecks: Identifies inefficiencies and bottlenecks in business processes, enabling timely interventions to improve workflow.
- Actionable Insights: Offers recommendations or alerts based on the data trends, helping teams to act proactively rather than reactively.
Real Business Use Case
- Holistic Performance Review: A retail chain utilizes a business operations dashboard to view sales, inventory, and customer feedback data in real time, allowing them to make informed decisions regarding stock levels and promotions.
- Cross-Department Collaboration: A manufacturing firm leverages the dashboard to align sales forecasts with production schedules, leading to better resource management and reduced operational costs.
- Rapid Response to Issues: A hospitality business monitors customer satisfaction and operational efficiency metrics on its dashboard, enabling quick adjustments to staffing levels during peak times based on real-time data.
Streamline Your Business Metrics with Minimal Dashboard
Having clear visibility of key performance indicators is crucial for maximizing revenue, and all-in-one business dashboards play an essential role in this process.
By consolidating data from various areas like sales, marketing, email marketing, subscription management, and customer support, these dashboards provide a comprehensive view of your business metrics.
Minimal Dashboard is your go-to solution for a user-friendly interface that integrates multiple data sources into one cohesive platform. This not only simplifies your data analysis but also allows for greater customization and a visually appealing experience.
