What we cover in this article
Discover how CFO dashboards, such as Financial Ratio and Cash Flow, empower financial leaders with real-time insights into key metrics like revenue and profitability. Simplify reporting with Minimal Dashboard's customizable, data-integrated tools, enabling fast, data-driven decisions for business growth. Explore examples, key elements, and practical use cases.
Contents
- Introduction
- Looking for a Smarter Way to Track Financial Metrics?
- Why Listen to Us?
- What is a CFO Dashboard?
- Why is a CFO Dashboard Important?
- 5 CFO Dashboard Examples
- Streamline CFO Reporting with Minimal Dashboard
Introduction
This article explores CFO dashboards, showcasing examples like Financial Ratio, Cash Flow, and Budget vs. Actual dashboards, along with their key elements and practical uses. CFO dashboards provide financial leaders with real-time insights into metrics such as cash flow, revenue, and profitability. Minimal Dashboard simplifies the reporting process, integrating data seamlessly into customizable, visually clear dashboards to support CFOs in making fast, data-driven decisions.
Looking for a Smarter Way to Track Financial Metrics?
For CFOs, tracking financial data is essential, but doing it efficiently can be challenging. That’s where a CFO dashboard comes in.
CFO dashboards offer financial leaders real-time insights into cash flow, revenue, and expenses, helping them make quicker, data-driven decisions.
In this article, we’ll showcase some CFO dashboard examples, highlight key elements, and explain their practical use cases to simplify your financial reporting.
But first…
Why Listen to Us?
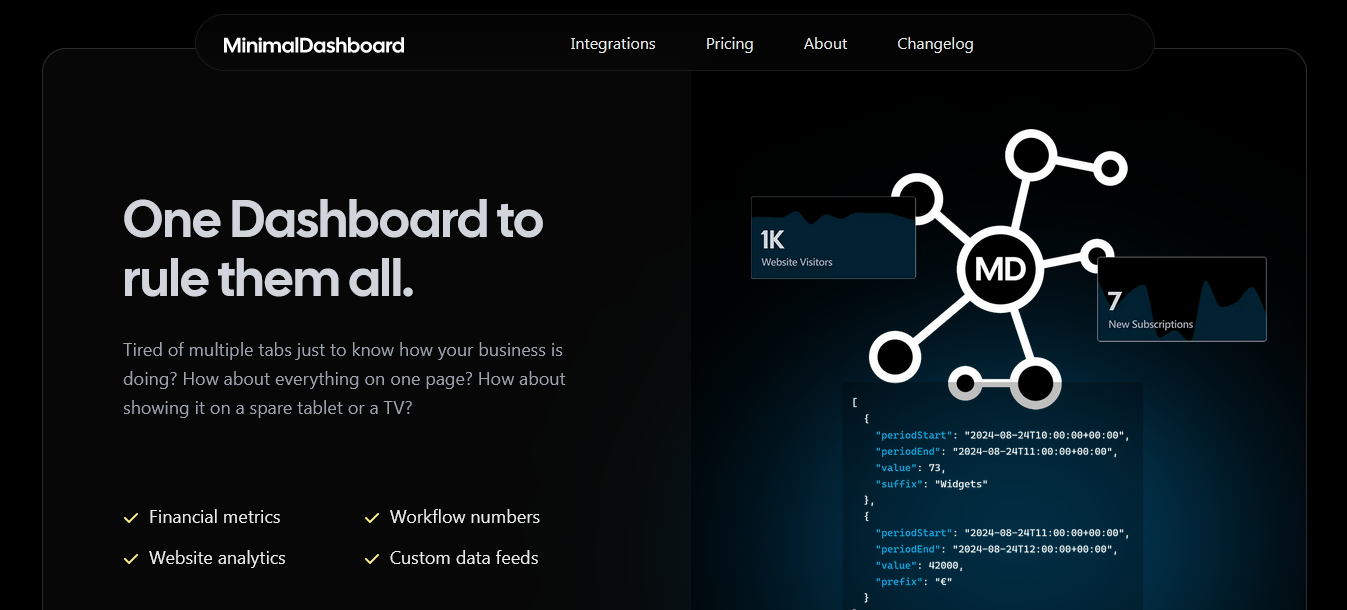
At Minimal Dashboard, we specialize in simplifying financial reporting. Our platform consolidates real-time data from multiple sources, giving CFOs a clear, customizable dashboard. We make it easy to track the metrics that matter most, so you can focus on driving business growth without the hassle of juggling multiple tools.
What is a CFO Dashboard?
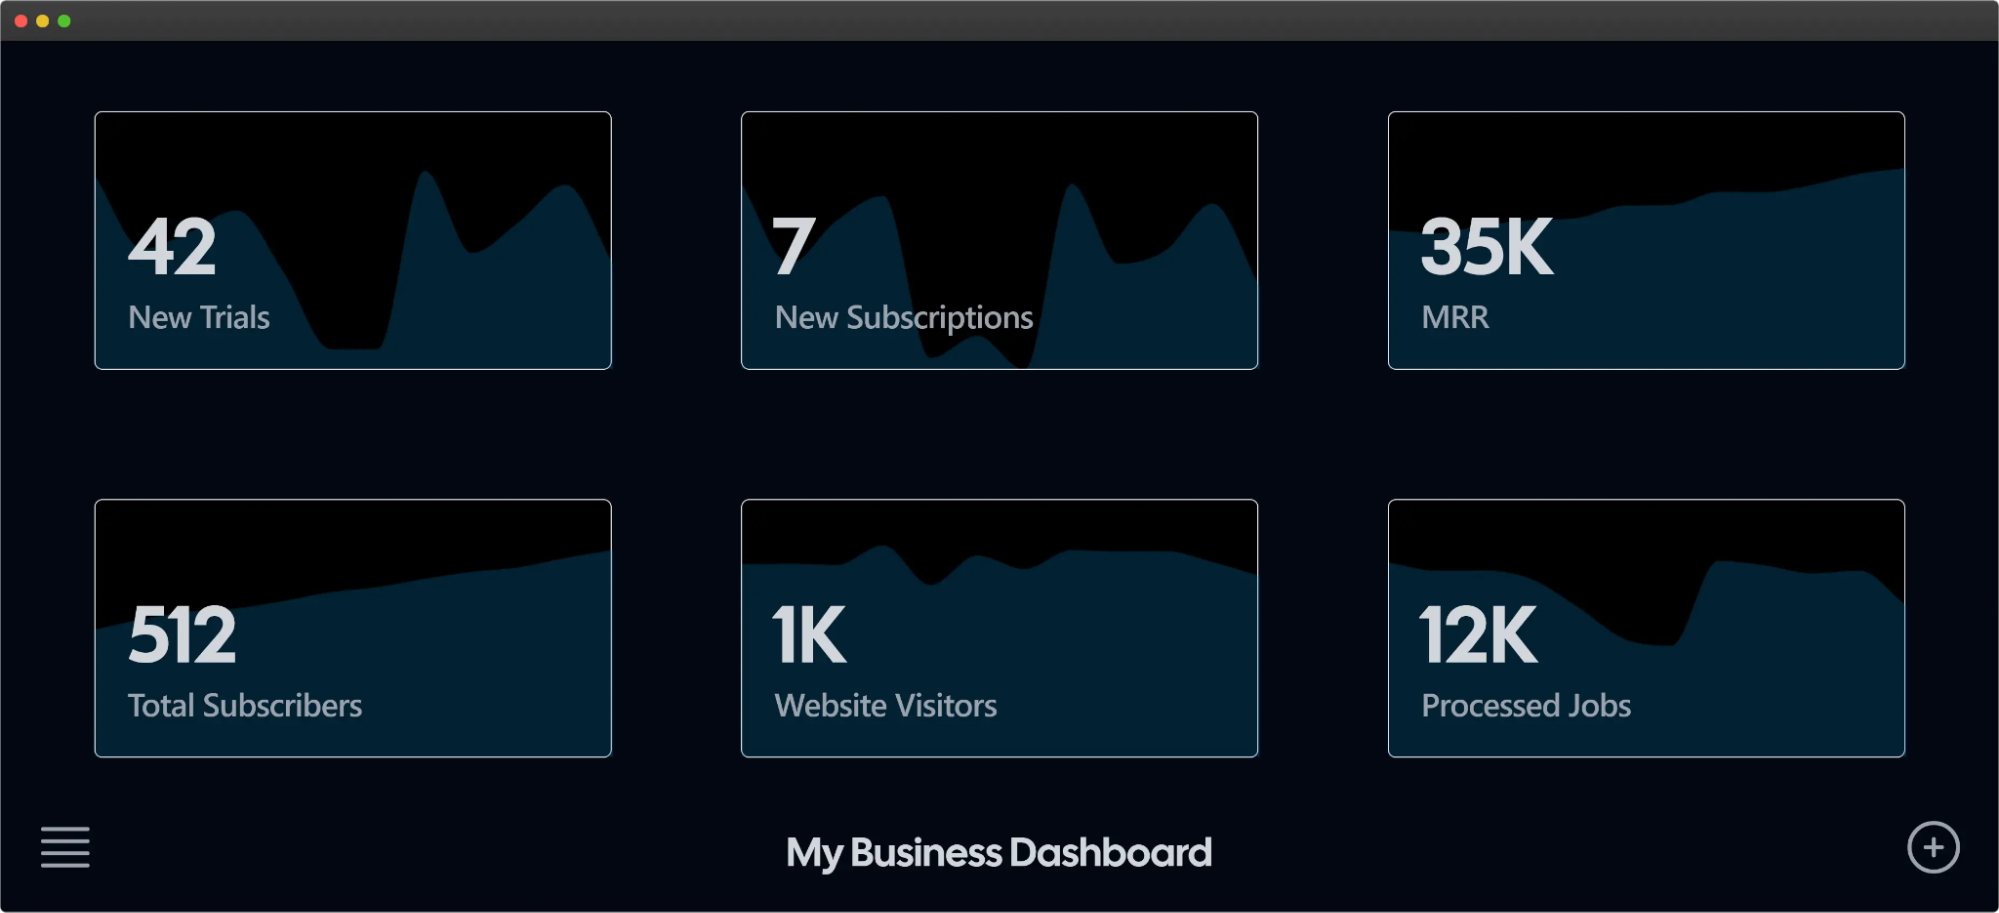
A CFO dashboard is a tool that helps Chief Financial Officers (CFOs) track and manage essential financial metrics in real-time. It consolidates data like cash flow, revenue, expenses, and profit margins into a single, easy-to-read display. This provides CFOs with quick insights for informed decision-making.
By visualizing key financial data, CFO dashboards allow CFOs to spot trends, forecast future performance, and address issues before they become critical.
Why is a CFO Dashboard Important?
A CFO dashboard is crucial because it delivers real-time insights into a company’s financial performance. Its importance includes:
- Fast Access to Key Metrics: Tracks essential metrics like cash flow, revenue, and expenses for quick, informed decisions.
- Trend and Issue Identification: Allows CFOs to see trends, spot issues early, and take action before problems escalate.
- Streamlined Reporting: Reduces the need to compile data from multiple sources manually, saving time and ensuring accuracy.
- Strategic Focus: A centralized dashboard tool, like Minimal Dashboard, supports better strategic planning and improves financial health by enhancing decision-making efficiency.
5 CFO Dashboard Examples
1. Financial Ratio Dashboard
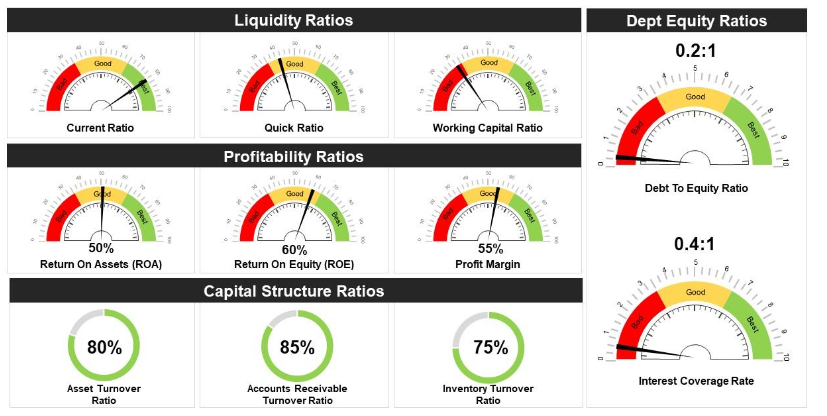
A Financial Ratio Dashboard provides CFOs with a high-level overview of critical financial ratios, offering insight into a company’s financial health and performance. With real-time access to ratios like debt-to-equity, current, and return on equity (ROE), this dashboard equips financial leaders to evaluate liquidity, profitability, and solvency—vital for strategic planning and stability.
Key Elements
- Debt-to-Equity Ratio: Measures a company’s financial leverage, indicating the proportion of debt to shareholders’ equity.
- Current Ratio: Assesses liquidity by comparing current assets to current liabilities, helping gauge short-term financial health.
- Return on Equity (ROE): Evaluates how effectively a company generates profit from shareholders’ investments.
Practical Use Cases
- Liquidity Assessment: Regularly monitor liquidity ratios to ensure sufficient funds are available for daily operations and emergency needs.
- Debt Management: Track debt-to-equity ratios to inform strategies on managing or restructuring debt, optimizing leverage, and improving creditworthiness.
- Shareholder Reporting: Use key ratios for quarterly updates, offering stakeholders clear, data-driven insights into financial performance and growth trajectory.
With Minimal Dashboard’s customizable features and integrations, CFOs can monitor these ratios in real-time, making well-informed decisions that drive sustainable growth.
2. Cash Flow Dashboard
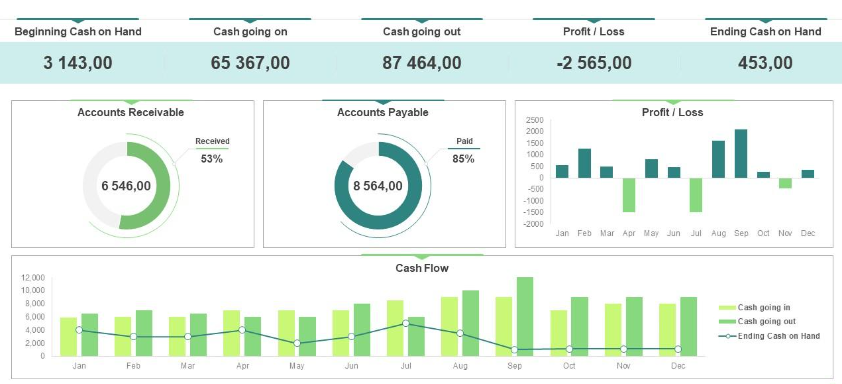
A Cash Flow Dashboard gives CFOs a clear, real-time view of the company’s cash inflows and outflows, helping to ensure healthy liquidity and financial stability. By tracking critical metrics like net cash flow, operating cash flow, and cash flow trends, this dashboard allows CFOs to manage the company’s cash position effectively, prevent shortfalls, and plan for future investments.
Key Elements
- Net Cash Flow: Measures the net movement of cash in and out of the business over a set period, indicating overall cash health.
- Operating Cash Flow: Tracks cash generated from core business operations, offering insight into the company’s financial viability.
- Cash Flow Trends: Displays cash movement over time, helping identify seasonal fluctuations and patterns in cash flow.
- Cash Burn Rate: Monitors how quickly a company spends its available cash, essential for assessing financial runway and sustainability.
Practical Use Cases
- Liquidity Planning: Use net and operating cash flow metrics to ensure there is sufficient cash to cover day-to-day expenses, payroll, and other obligations.
- Investment Decisions: Evaluate cash flow trends to make informed decisions on new investments, expansion, or debt repayment.
- Crisis Management: Monitor cash burn rate closely to avoid liquidity issues during downturns or unexpected expenses, keeping the company financially agile.
- Budget Adjustments: Analyze monthly cash flow data to adjust budgets as needed, ensuring cash allocation aligns with business priorities and minimizes waste.
3. Profitability Dashboard
A Profitability Dashboard enables CFOs to track profit margins and manage costs, giving a clear view of the company’s overall financial performance.
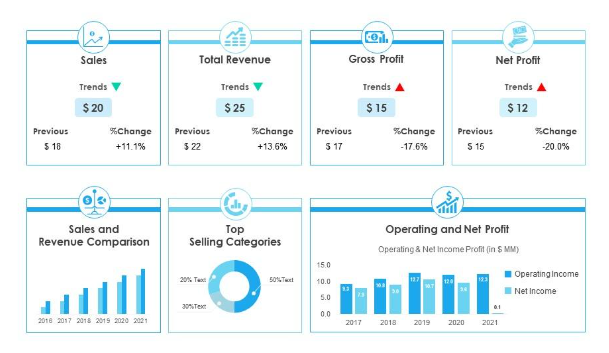
By monitoring metrics like gross profit margin, operating profit margin, and net profit margin, this dashboard helps CFOs pinpoint the most profitable areas of the business and uncover opportunities to improve efficiency and maximize returns.
Key Elements
- Gross Profit Margin: Shows the percentage of revenue left after direct costs, providing insight into the profitability of products or services.
- Operating Profit Margin: Measures profitability after operating expenses, essential for evaluating core business efficiency.
- Net Profit Margin: Indicates the final profitability after all expenses, taxes, and interest, reflecting the company’s bottom line.
- Break-Even Analysis: Identifies the point at which revenue covers total costs, helping guide pricing and sales strategies.
Practical Use Cases
- Cost Management: Track profit margins across departments or product lines to identify high-cost areas, helping to optimize spending and reduce waste.
- Profitability Analysis: Use gross and net profit margins to assess which products or services yield the highest returns, supporting strategic growth.
- Performance Benchmarks: Monitor operating margins to benchmark against industry standards, ensuring the company remains competitive.
- Resource Allocation: Leverage profitability metrics to prioritize investment in high-margin areas, aligning resources with the most profitable opportunities.
With Minimal Dashboard, CFOs can seamlessly monitor these critical metrics in real-time, creating a comprehensive financial overview that enables faster, data-driven decisions.
4. Revenue and Expense Dashboard
A Revenue and Expense Dashboard provides CFOs with a comprehensive view of the company’s revenue generation and spending patterns, enabling better financial forecasting and cost management.
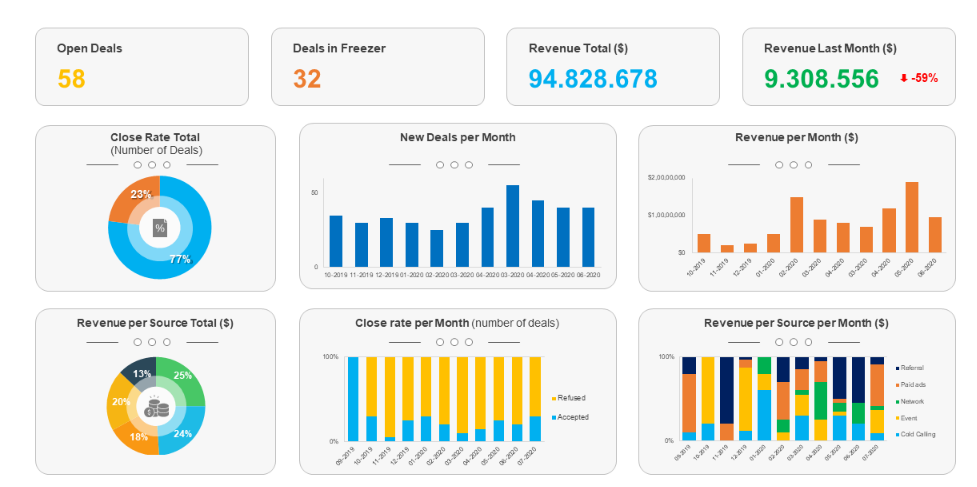
By tracking essential metrics like monthly recurring revenue (MRR), customer acquisition costs, and operational expenses, this dashboard helps CFOs understand the financial health of the business and make strategic adjustments to improve profitability.
Key Elements
- Monthly Recurring Revenue (MRR): Tracks consistent revenue from subscriptions or ongoing customer relationships, crucial for forecasting.
- Customer Acquisition Cost (CAC): Measures the cost to acquire new customers, providing insight into marketing and sales efficiency.
- Operational Expenses: Monitors day-to-day expenses, giving a clear picture of ongoing costs and potential savings.
- Revenue Growth Rate: Shows the pace of revenue growth over time, helping CFOs assess performance and set realistic targets.
Practical Use Cases
- Revenue Forecasting: Use MRR and revenue growth rate to create accurate forecasts, informing strategic planning and budget allocation.
- Cost Optimization: Track operational expenses and CAC to find areas where spending can be reduced or optimized without sacrificing growth.
- Profitability Analysis: Compare revenue and expenses to assess overall profitability and identify which areas are driving or draining profits.
- Financial Reporting: Generate clear, data-backed reports for stakeholders, showing revenue trends and cost management efforts.
By consolidating revenue and expense metrics into one accessible platform, Minimal Dashboard eliminates the need for time-consuming manual tracking across multiple tools, helping CFOs maintain tighter control over financial performance.
5. Budget vs. Actual Dashboard
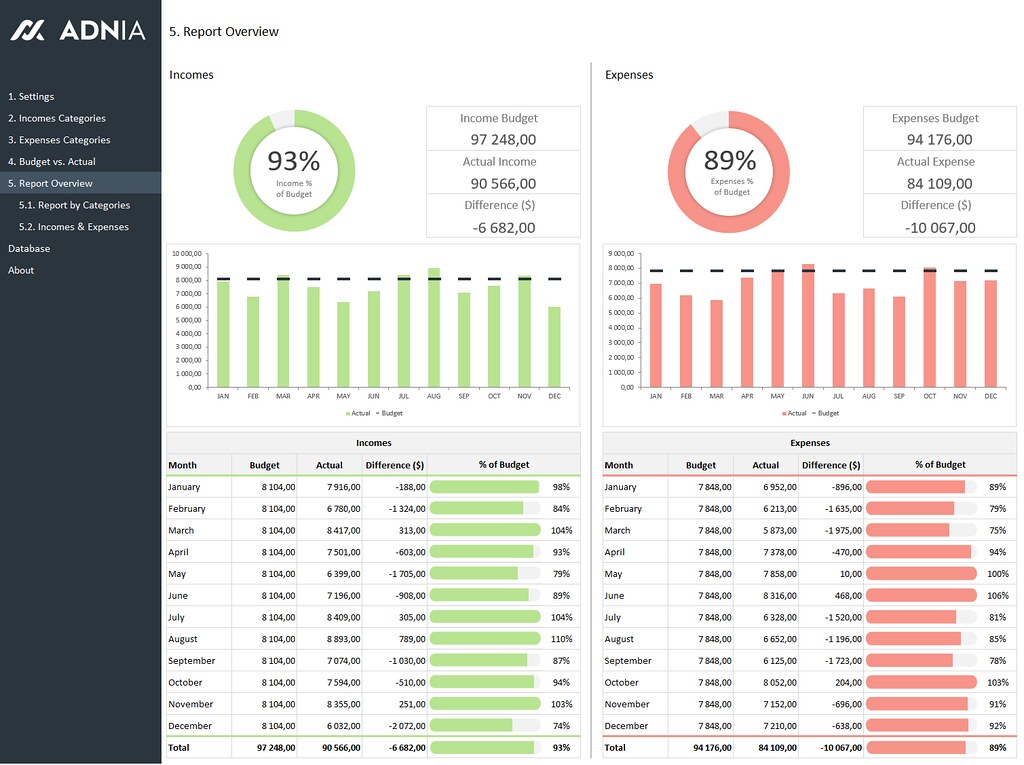
A Budget vs. Actual Dashboard allows CFOs to compare the company’s actual financial performance against its planned budget. This tool is essential for tracking how closely the organization adheres to its financial goals, helping identify discrepancies and enabling proactive adjustments to strategies and resource allocations. By visualizing this data, CFOs can gain valuable insights into financial discipline and operational efficiency.
Key Elements
- Budgeted Revenue: The projected income is based on forecasts, serving as a benchmark for evaluating actual performance.
- Actual Revenue: The real income generated during a specific period, providing insight into the effectiveness of revenue generation efforts.
- Budgeted Expenses: The planned expenditures for the period, guiding spending limits and financial planning.
- Actual Expenses: The true costs incurred, highlighting variances from the budget and areas for potential savings.
- Variance Analysis: Shows the difference between budgeted and actual figures, helping CFOs understand where they are over or under budget.
Practical Use Cases
- Performance Tracking: Regularly assess budgeted versus actual figures to ensure financial discipline and accountability across departments.
- Strategy Adjustment: Use variance analysis to identify areas needing attention, allowing CFOs to adjust budgets or operational strategies in real-time.
- Resource Allocation: Evaluate budget discrepancies to reallocate resources more effectively, ensuring funds are directed toward high-impact areas.
- Stakeholder Communication: Provide clear, visual reports for stakeholders that outline budget adherence and financial performance, fostering transparency and trust.
Streamline CFO Reporting with Minimal Dashboard
Ready to simplify your financial reporting and decision-making? Minimal Dashboard offers everything you need to create customizable, real-time CFO dashboards that consolidate your essential metrics into one place.
With seamless data integration, intuitive visualizations, and collaborative features, you’ll have all the tools to make informed, data-driven decisions without the complexity.
Stay on top of your company’s performance effortlessly and focus on what matters most: growing your business.
