What we cover in this article
Discover the top 10 KPI dashboards that transform complex data into actionable insights, streamlining decision-making and goal tracking. From user-friendly Minimal Dashboard to AI-driven ThoughtSpot, these customizable tools cater to businesses of all sizes, enhancing efficiency and agility with real-time data.
Contents
- Introduction
- What is a KPI Dashboard?
- Top 10 KPI Dashboard Examples
- Why You Need a KPI Dashboard for Your Business
- How to Choose KPIs for Your Dashboard
- Conclusion
Introduction
Tracking KPIs can be challenging for businesses, especially when managing multiple metrics across departments. A KPI dashboard offers a streamlined solution by providing real-time insights and a centralized view of your organization’s key performance indicators. It helps simplify data into easy visuals, allowing for smarter decision-making and goal tracking.
These tools are customizable to suit the unique needs of any business, whether you’re looking for in-depth customization or a simple interface. Regardless of your company size, a KPI dashboard is essential for staying agile, monitoring progress, and adjusting strategies based on real-time data.
Fortunately, in this Minimal Dashboard guide, we will explore 10 best KPI dashboard examples, to help you select the perfect solution for your business needs.
What is a KPI Dashboard?
A KPI dashboard visually presents key performance indicators, tracking progress toward strategic goals. Without proper insights, your business can struggle to reach its potential. KPI dashboards turn data into actionable insights, guiding informed decisions and enhancing efficiency.
Top 10 KPI Dashboard Examples
- Minimal Dashboard
- Smartsheet
- Tableau
- ThoughtSpot
- Databox
- Power BI
- Sisense
- Airtable
- KPI Fire
- SimpleKPI
1. Minimal Dashboard
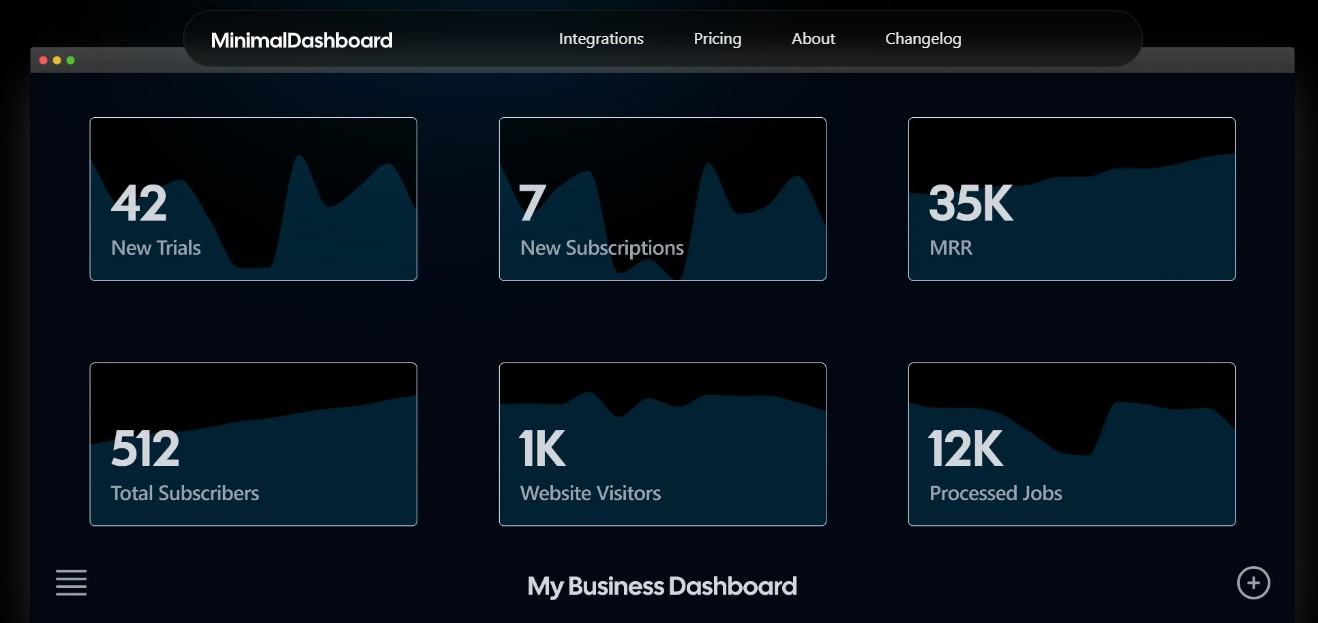
Minimal Dashboard provides a user-friendly platform for monitoring all your essential KPIs. Its customizable dashboards, automated updates, and real-time analytics keep every critical metric in focus, empowering you with timely data to make well-informed decisions that will spur your business growth.
Key Features
- Instant visibility: Get real-time access to your key metrics, allowing you to monitor business performance and stay updated on critical data.
- Automated daily reports: Receive daily reports with a summary of your important metrics, eliminating the need for manual tracking.
- Alerts for unusual activity: Set up notifications for any unexpected spikes or dips, enabling quick responses to sudden changes.
- Historical metrics tracking: Track the history of your metrics through visual snapshots, helping you identify trends over time.
- Event journaling: Log significant events and link them to the metrics at the time to better analyze their impact on performance.
- Trend forecasting: Predict future trends and explore “what if” scenarios, helping you plan and optimize your strategies ahead of time.
Pros
- View metrics in real-time
- Easy to set up and manage, even for beginners
- User-friendly interface
- AI-assisted trend spotting is available
Cons
- Mobile app not yet available
Pricing
We offer a free trial on each of our premium plans starting with the Solo plan at $15 per month. The Startup and Business plans cost $39 and $99 respectively.
2. Smartsheet
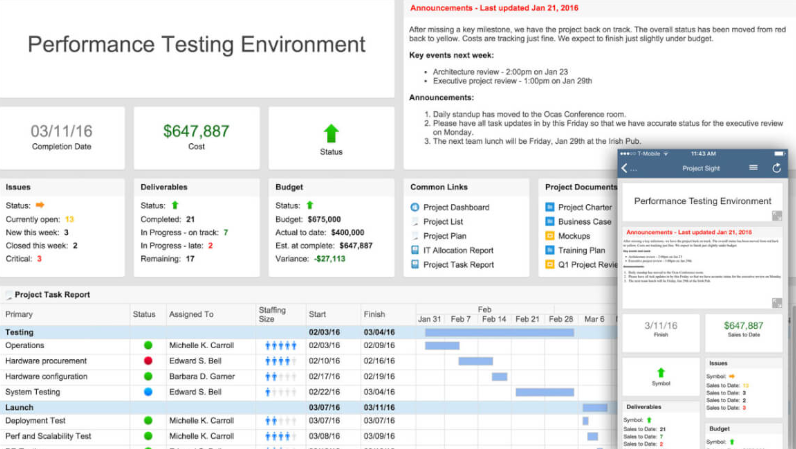
Smartsheet is a spreadsheet-like app used for managing various types of work, including team projects, task lists, sales pipelines, and event schedules. Its platform offers a range of tools for workflow automation, content collaboration, forms management, and real-time data tracking.
Key Features
- Collaborative Work Sharing: Easily share and collaborate on tasks with team members.
- Automated Alerts: Set reminders for upcoming tasks and deadlines.
- Visual Task Management: Provides a visual way to manage and track projects.
- Quick Status Overview: Get visual summaries and access key project information quickly.
Pros
- Recognizable Excel-like interface with extensive features
- Allows simultaneous work and automatic reminders
- Integrates with popular apps like Google Drive, Microsoft Teams, Slack, etc.
Cons
- Some users find the interface complicated
- Missing basic features like Merge Cells
- Lacks advanced Excel functionalities like Visual Basic
Pricing
Users can make use of Smartsheet’s free trial plan before purchasing which starts at $12 per user monthly.
3. Tableau
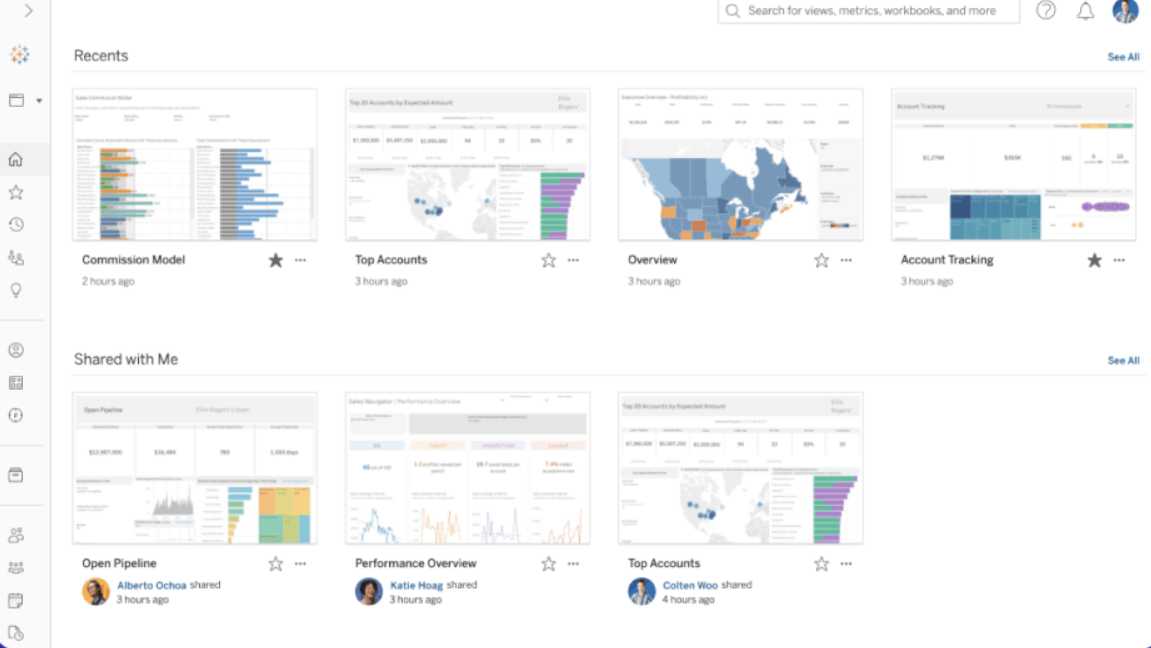
Tableau is an interactive data visualization platform and business intelligence tool that transforms data into dynamic visual analytics. Unlike traditional spreadsheets, Tableau enables users to understand data quickly, make informed decisions, and tackle problems effectively.
Key Features
- AI Assistant with Einstein Copilot: Enhances decision-making with AI-driven insights.
- User Management: Streamlines access control and user permissions.
- Sensitive Data Identification: Automatically detects and flags sensitive information.
- Information Governance: Ensures data integrity and compliance.
Pros
- Facilitates collaborative data exploration
- Provides up-to-the-minute insights
- Consolidates all data views in one place
Cons
- High cost of licenses
- Requires advanced skills to get the best out of it
- May lag with large datasets
- Lacks some flexibility in customization options
Pricing
Tableau offers amazing features but at a cost. The lowest plan costs $35 per user monthly which is billed annually at $420.
4. ThoughtSpot
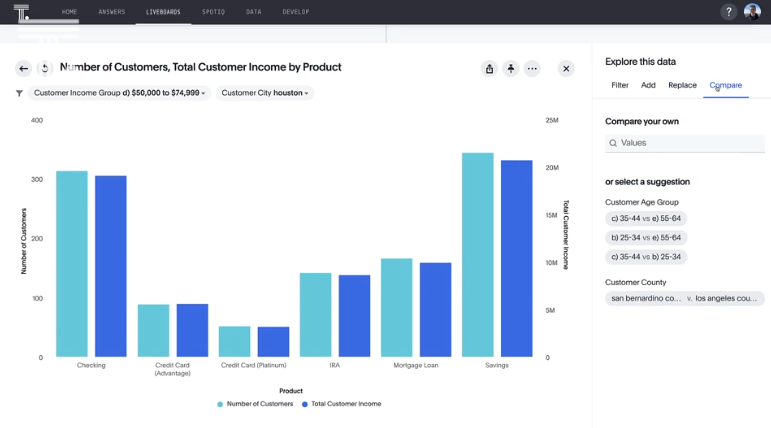
ThoughtSpot is an AI-powered analytics platform that makes advanced data analysis accessible to everyone within an organization. It allows users to perform natural language searches on large data sets, delivering immediate, AI-driven insights without requiring deep expertise in data science.
Key Features
- Natural Language Search: Query data like a Google search, generating insights without complex coding.
- AI-Driven Analytics: Instantly identify trends, anomalies, and key metrics through AI-powered insights.
- Robust Cloud Data Support: Seamlessly integrates with major cloud data warehouses like Snowflake and Amazon Redshift.
Pros
- Powerful AI capabilities
- Easy setup for data models
- Intuitive, search-based interface
- Integrates well with various data sources
Cons
- Limited chart options
- Difficult to adjust data layouts
- Some users find report-building challenging
- High cost
Pricing
ThoughtSpot offers a 14-day free trial, with Essentials starting at $1250/month afterward.
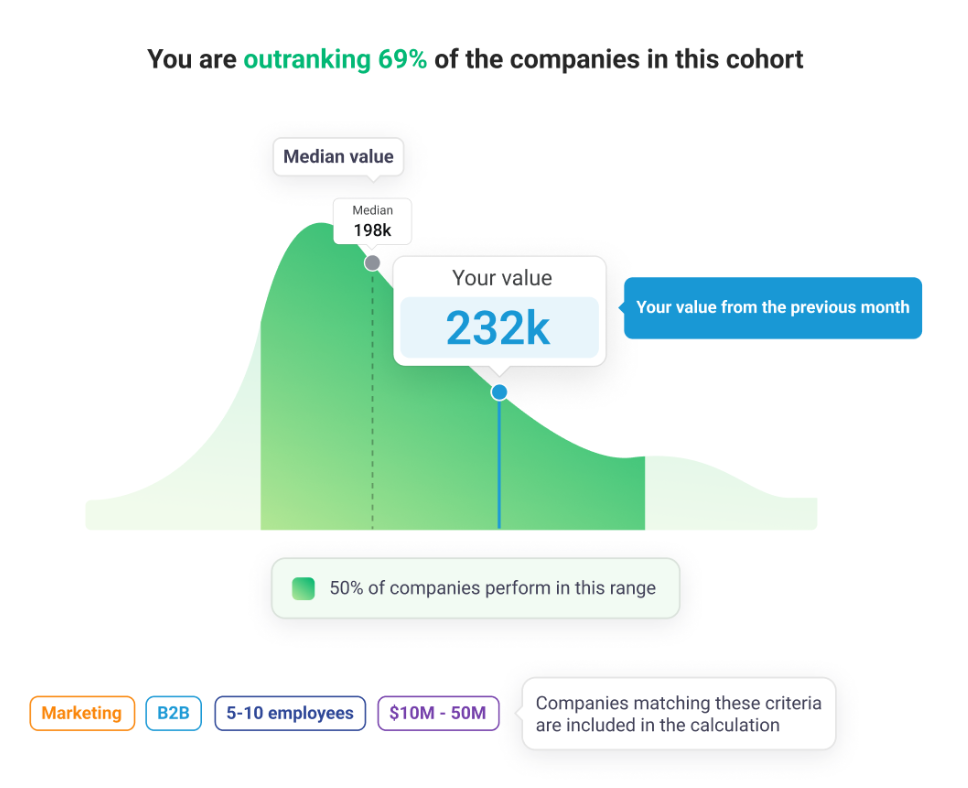
5. Databox
Databox is a cloud-based business analytics platform that centralizes KPI reports, helping companies monitor performance and make informed decisions. It provides a unified interface for tracking business metrics, ensuring that strategies are based on reliable data insights.
Key Features
- Integrated Dashboard: Combine KPIs from various sources into one dashboard, avoiding multiple platform logins.
- Customizable Dashboards: Build custom dashboards and views without needing coding skills.
- Integrations: Seamlessly connects with over 70 tools for marketing, social media, CRM, and sales.
Pros
- Clear and user-friendly interface
- Easy report sharing
- Real-time data updates
- Free to use
Cons
- Expensive higher-tier plans
- Limited customization for reporting
- Restricted access to simultaneous dashboards
Pricing
Individuals and small teams can take advantage of the free account with standard features. The costs for the premium features start at $47 per month.
6. Power BI
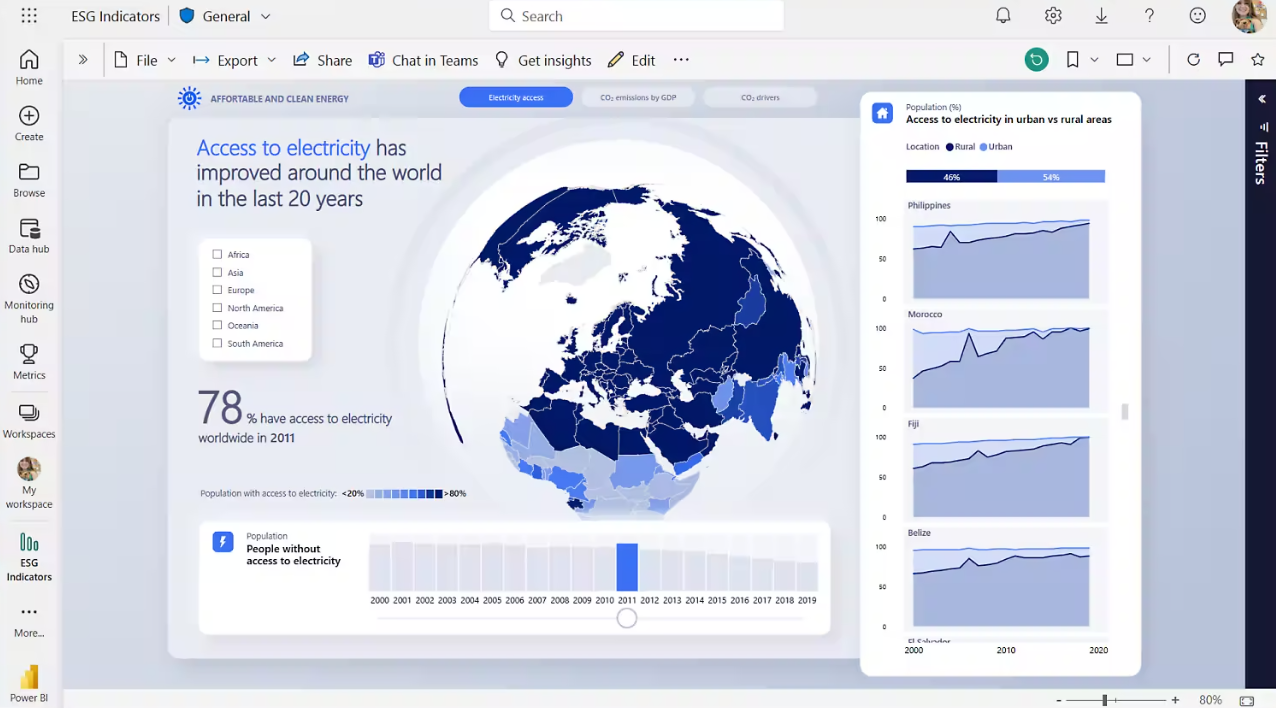
Microsoft Power BI is a robust tool for businesses requiring advanced data analysis and visualization. It enables companies to create interactive reports and dashboards by connecting to various data sources, including Excel, SQL Server, and cloud services.
Key Features
- Data Connectivity: Offers over 100 connectors for diverse data sources like SQL Server and Google Analytics.
- Interactive Dashboards: Includes rich visualization tools, drill-downs, slicers, and cross-filtering.
- Advanced Analytics: Integrates machine learning models and predictive analytics.
Pros
- Free plan available
- Frequent updates and enhancements
- Connects to hundreds of data sources
- Data can be exported to Excel
Cons
- Steep learning curve for beginners
- Limited customization and formatting options
- Some visuals cannot be fully configured
Pricing
Using a Microsoft Fabric account, you can use Power BI for free with limited features. Premium features start at $10 per month per user.
7. Sisense
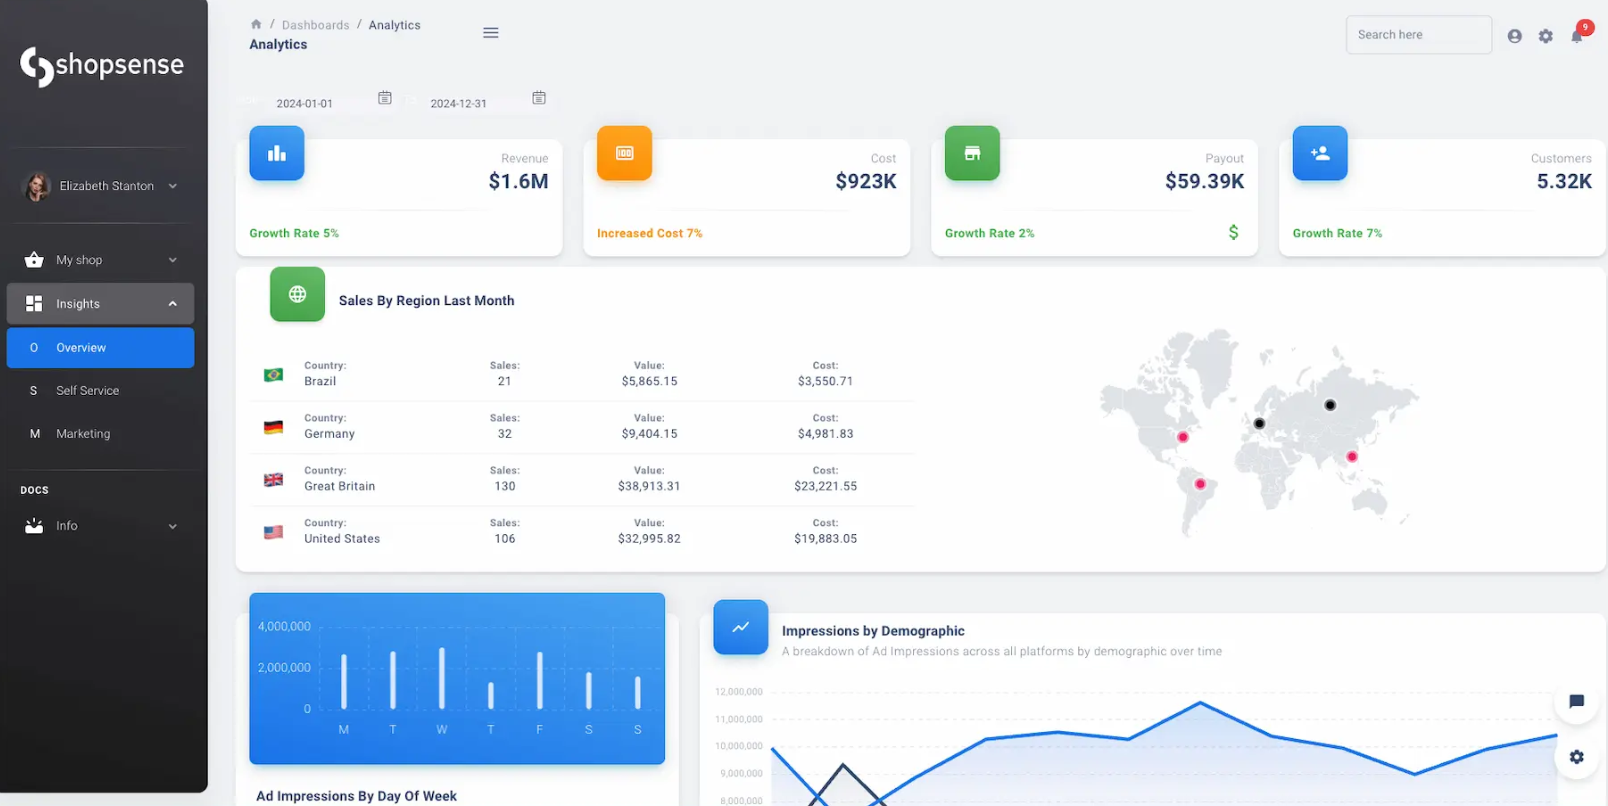
Sisense is an end-to-end business intelligence platform that enables companies to merge data from various sources and create visually compelling reports. It helps provide a deeper understanding of performance by offering actionable insights.
Key Features
- BI Software Dashboard: Consolidate complex data into KPI reports for actionable insights.
- Finance KPIs: Monitor financial metrics like ROI, profits, expenses, and investments.
- Customer Service Monitoring: Track customer service performance through KPIs like support tickets and NPS scores.
Pros
- Secure data management
- Exceptional customer support
- Robust data discovery tools
Cons
- Steep learning curve
- Limited permission settings for dashboard publishing
- Heavy application that can slow down systems
Pricing
Sisense’s pricing is customized based on user needs and budget. You’ll have to contact them for details.
8. Airtable
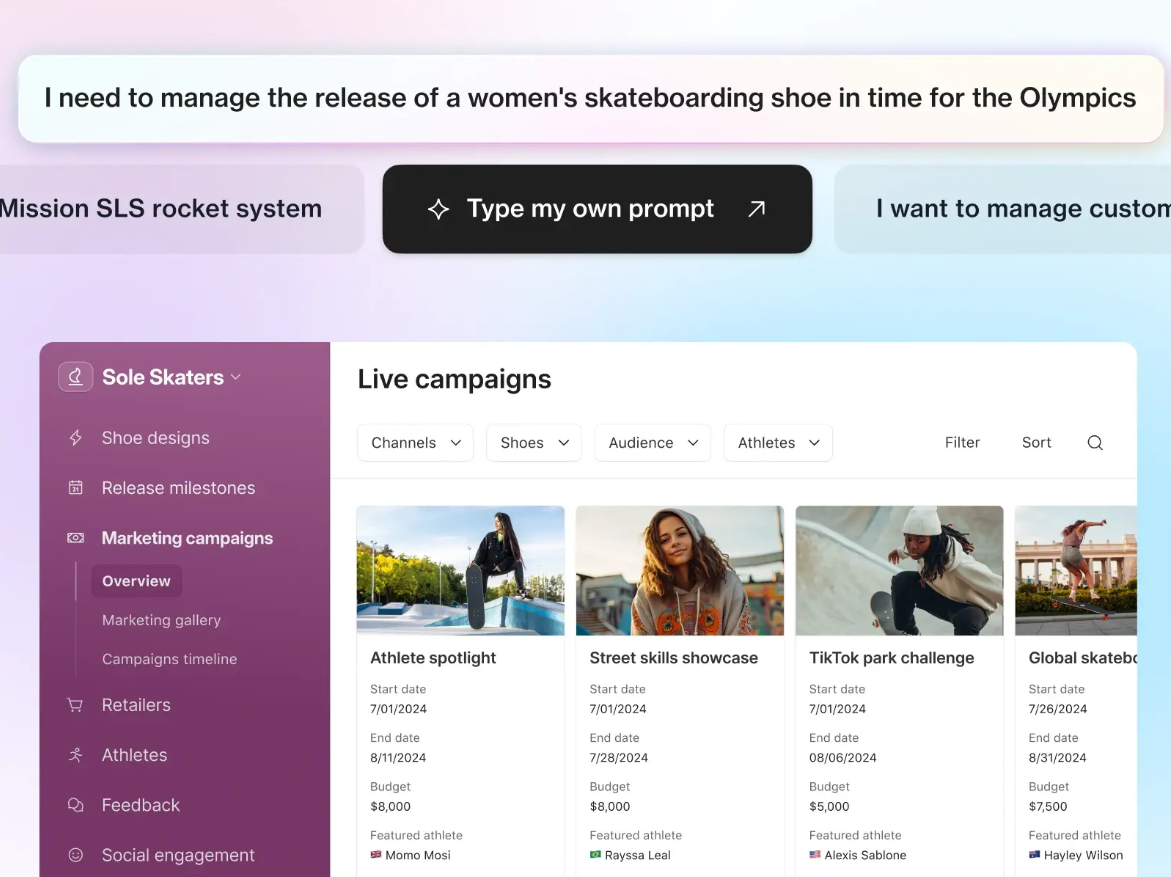
Airtable is a collaborative platform that empowers businesses in managing content pipelines, product development, event planning, and user research with flexibility and ease.
Key Features
- Customizable Views: Tailor data analysis and organization with various customizable views.
- Role Assignment: Control collaborator permissions for secure and accurate teamwork.
- Reporting: Create custom reports with extensions for charts, graphs, and top-line metrics.
- Supports Multiple Integrations: Connect with tools like Asana, Google Drive, Slack, and more.
Pros
- Free forever plan with affordable upgrades
- Visually appealing and intuitive interface
- Real-time collaboration with customizable task management
Cons
- Limited customization in the free plan
- Gantt tools require top-tier accounts
- Learning curve for advanced features
Pricing
Airtable’s free version is available for individuals or small teams, with premium plans starting at $24 per month.
9. KPI Fire
KPI Fire is a strategic planning and execution platform rooted in Lean Six Sigma principles. It enables companies to link projects with strategic goals, manage initiatives, and monitor KPIs in real-time, ensuring alignment across all organizational levels.
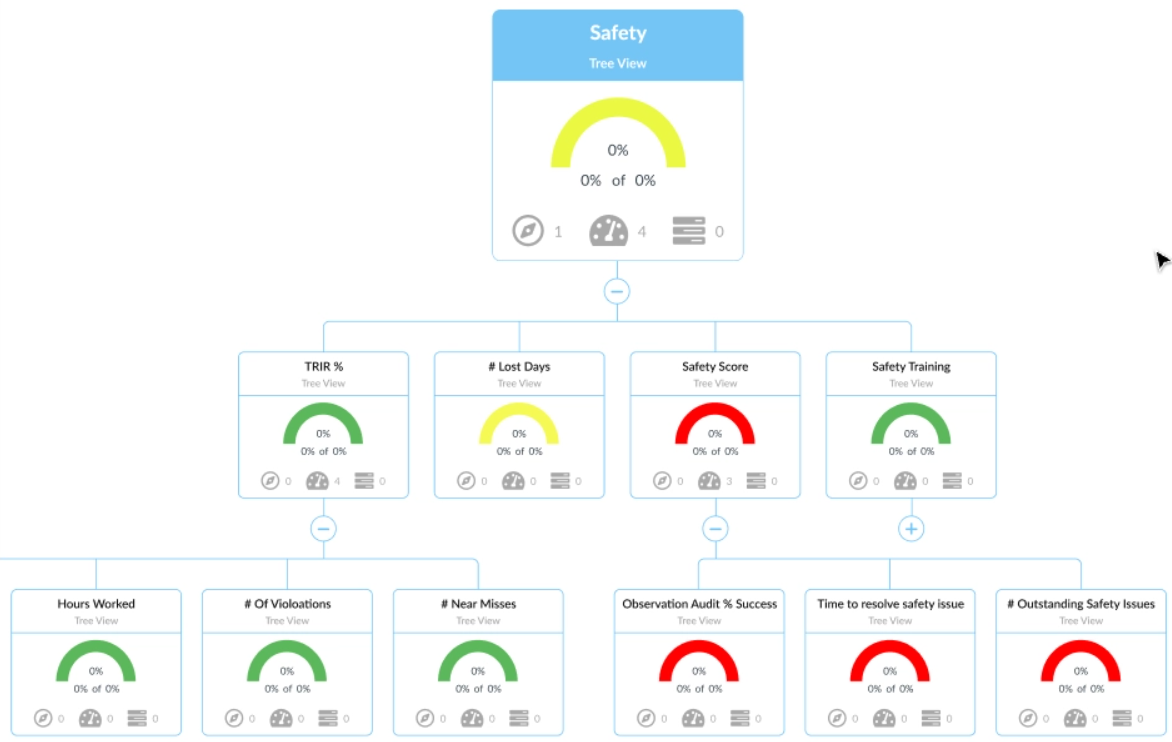
Key Features
- Strategy Planner: Cascade goals across the organization with visual indicators for objective status.
- KPI Dashboards: Monitor real-time KPI updates with color-coded charts for quick status checks.
- Idea Generator: Transform employee ideas into actionable projects aligned with company goals.
- Project Workflow: Create detailed task workflows, including assignments, deadlines, and priorities.
Pros
- Aligns projects with long-term organizational goals
- Easy-to-use dashboards for tracking progress
- Intuitive and user-friendly
Cons
- Limited advanced data analysis features
- Reports may lack visual appeal
Pricing
KPI Fire’s pricing details are available upon request from the team or by scheduling a demo.
10. SimpleKPI
SimpleKPI is a user-friendly dashboard tool that helps businesses track and manage their performance metrics.
Key Features
- Goal Setting: Define and monitor KPI targets in real-time through customizable dashboards.
- KPI Library and Templates: Access a predefined library of industry-standard KPIs with customizable templates.
- Collaboration and Sharing: Easily share dashboards and reports with your team.
Pros
- Supports unlimited users and dashboards
- Offers significant discounts for charities and educational institutions
- Transparent and straightforward pricing
Cons
- Limited customization features
- No mobile app available
Pricing
A 14-day free trial is offered, with premium plans starting at $79 per month.
Why You Need a KPI Dashboard for Your Business
Data is only valuable when it’s understandable. As the amount of data you collect rises, making sense of it becomes more challenging. This is where KPI dashboards come in. Let’s explore how they achieve this.
1. Improves Executive Decision-Making
KPI dashboards eliminate the need for executives to wait on departmental reports. Instead, all essential performance data is centralized, providing a single, reliable source for the organisation’s KPIs. This real-time visibility into team performance allows executives to identify areas needing attention, accelerating the achievement of business objectives.
2. Facilitates Real-Time, Scalable Data Analysis
KPI dashboards provide real-time insights into business operations, allowing executives to analyze specific KPIs without the hassle of sifting through numerous spreadsheets or programs. The interactive elements of the dashboard make it easy to drill down into the details.
3. Boosts Operational Efficiency
KPI dashboards streamline workflows by giving employees immediate access to critical data. For instance, if the marketing team requires conversion rate data from sales or customer satisfaction scores from support, they can retrieve this directly from the dashboard, avoiding delays and increasing productivity.
4. Helps Prioritize Critical Tasks
Decision-makers often struggle with data overload. KPI dashboards organize and visualize key information, allowing you to focus on what truly matters without feeling overwhelmed. This clarity helps you quickly identify priorities and allocate resources effectively.
5. Promotes Collaboration and Transparency
With a shared KPI dashboard offering real-time data, teams can make informed decisions independently, reducing the need for constant input from others. This distribution of data fosters collaboration, speeds up communication, and enhances overall team alignment and satisfaction.
6. Offers Predictive Insights for Growth
KPIs measure your progress toward goals. A KPI dashboard helps you assess your business trajectory, revealing patterns that aid in forecasting growth. This tool is especially valuable for small businesses looking to scale quickly by identifying the next steps needed to achieve their objectives.
How to Choose KPIs for Your Dashboard
1. Consider the Audience
When setting up a dashboard, it’s vital to think about who will be using it. Tailor the KPIs to the specific needs of the intended users. For instance, a marketing dashboard should focus on metrics that benefit the marketing team, even though other departments like sales or finance might access it.
Overloading the dashboard with irrelevant data can distract the team from critical insights, diminishing its effectiveness. A well-designed dashboard should clearly convey the most relevant data to its primary users, helping them track performance and make informed decisions. This ensures the dashboard serves its purpose—facilitating strategy and decision-making within the team.
2. Choose Relevant KPIs
A dashboard is only as valuable as the KPIs it tracks. Start by identifying your core business objectives, and then select KPIs that align directly with these goals. If the KPIs on your dashboard don’t contribute to your primary objectives, they’re just taking up space.
To create effective KPIs, consider the SMART criteria: specific, measurable, achievable, relevant, and time-bound. These key performance indicators should provide clear signs of progress toward your goals. For example, if growing the company is a key objective, include metrics like sales revenue, net profit, and active customer count—each directly tied to your growth targets.
3. Avoid Vanity Metrics
Vanity metrics are impressive on the surface but don’t offer meaningful insights into your business performance. To identify vanity KPIs, ask yourself whether the metric will influence a decision or lead to action. If not, it’s likely just for show - focus on metrics that drive strategic decisions and reflect true performance.
4. Include Automatically Populated KPIs
One of the key benefits of dashboards is efficiency. They should automatically consolidate data from multiple sources into one user-friendly interface. However, if you include KPIs that require manual data entry, you introduce the risk of human error and delay.
Manual data entry can lead to inconsistencies, making the dashboard less reliable. Additionally, if the person responsible for updating the data is unavailable, it can result in outdated information. For the most accurate and timely insights, choose KPIs that are automatically updated from integrated data sources.
5. Include Both Leading and Lagging KPIs
KPIs are essential for tracking performance, but to get a complete picture, your dashboard should include both leading and lagging indicators. Lagging KPIs reflect past performance, offering insights into what has already happened. Leading KPIs, on the other hand, predict future performance and help guide your team toward meeting objectives.
For instance, in sales, leading KPIs might include the number of new opportunities or scheduled meetings, while lagging KPIs could track total sales or revenue generated. By combining both types, you can assess past performance while staying on track to achieve future goals.
Conclusion
Having the right tools to track and analyze key performance indicators (KPIs) is necessary to run a company. Whether you’re a small business or a large enterprise, choosing the right KPI dashboard can have a positive effect on your results when making data-driven decisions.
For a comprehensive solution that seamlessly integrates with your existing setup, consider Minimal Dashboard. With customizable designs, secure file delivery, and localized pricing, Minimal Dashboard empowers you to manage your digital products effortlessly and securely.
Explore Minimal Dashboard today and take the first step toward hitting your sales target.
