What we cover in this article
Explore top Geckoboard alternatives—Minimal Dashboard, Databox, Zoho Analytics, Microsoft Power BI, Domo, and Tableau. Each offers unique features, pricing, and use cases to enhance data visualization. Discover solutions that provide flexibility, integration, and advanced insights to meet your business needs and boost performance.
Contents
- Introduction
- Looking for the Best Geckoboard Alternatives?
- Why Listen to Us?
- Why Look for a Geckoboard Alternative?
- Top 6 Geckoboard Alternatives for Your Businesses
- Minimal Dashboard: The Geckoboard Alternative for All Your Data Requirements
Introduction
This article reviews top Geckoboard alternatives—Minimal Dashboard, Databox, Zoho Analytics, Microsoft Power BI, Domo, and Tableau—highlighting their unique features, pricing, and use cases. It’s crucial for businesses seeking advanced, flexible, and cost-effective data visualization solutions. Readers are encouraged to explore these tools, based on their specific needs. Visit the Minimal Dashboard blog for deeper insights into choosing the best dashboard tools and strategies to enhance your business’s performance.
Looking for the Best Geckoboard Alternatives?
Geckoboard is a trusted choice for visualizing KPIs and tracking performance metrics, but as business needs evolve, it may fall short in areas like flexibility, integrations, and advanced insights. Exploring alternatives can help you find a solution better suited to your data goals.
In this article, we’ll walk you through six top Geckoboard alternatives, comparing features, pricing, pros, and cons to help you find the ideal tool for your data visualization needs.
But first…
Why Listen to Us?
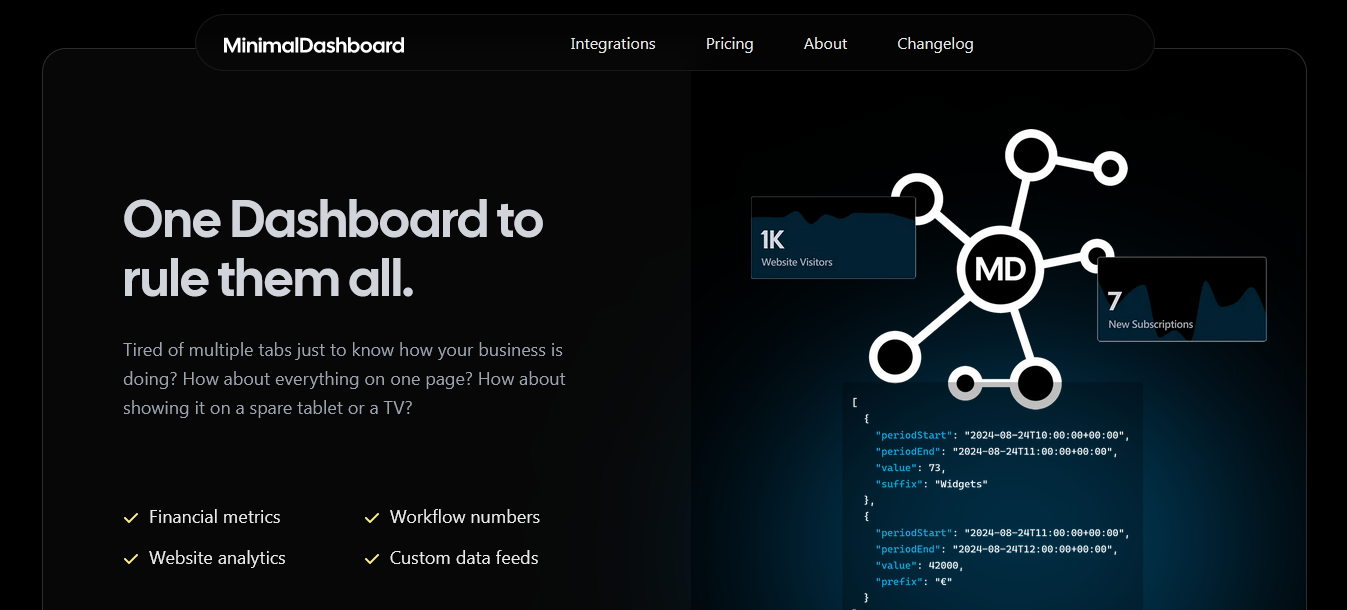
Minimal Dashboard provides a user-friendly solution for keeping track of essential business metrics. Our customizable dashboard offers real-time data consolidation, allowing you to make well-informed, data-driven decisions with ease. With our expertise, you can streamline the monitoring process and direct your focus toward driving your organization’s success.
Why Look for a Geckoboard Alternative?
Geckoboard is a popular tool for data visualizing and displaying key business metrics. However, it might not always meet the needs of growing or complex organizations. Here are a few reasons why you might look for a Geckoboard alternative:
- Limited Customization: Geckoboard offers a straightforward interface, but it lacks in-depth customization options, which can be restrictive for businesses with specific data visualization needs.
- Limited Features: Geckoboard lacks some advanced features that growing businesses often need. For example, its Shopify filters are limited, and while users can display top-performing Instagram posts, the data lacks depth and customization options.
- Few Integrations: Although it integrates with major platforms, Geckoboard doesn’t support as many third-party applications as some other tools, which can limit its usefulness for data-heavy operations.
- Basic Analytics: Geckoboard is designed to display metrics rather than analyze them, so businesses looking for advanced analytics capabilities may find it lacking.
- High Cost for Larger Teams: Geckoboard’s pricing can quickly become expensive, especially for bigger teams or companies needing multiple dashboards.
- Limited Real-Time Updates: While it provides live updates, some users have reported delays, impacting decision-making when instant insights are required.
Top 6 Geckoboard Alternatives for Your Businesses
- Minimal Dashboard
- Databox
- Zoho Analytics
- Microsoft Power BI
- Domo
- Tableau
1. Minimal Dashboard
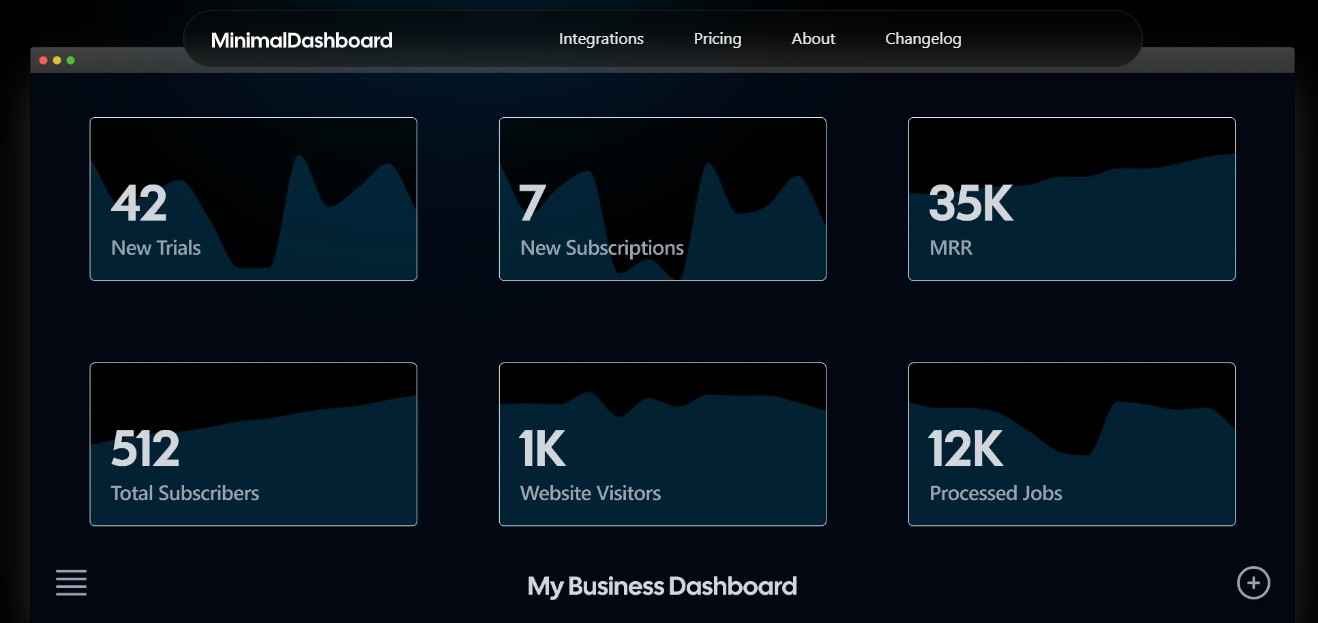
Minimal Dashboard is a data visualization tool that sets itself apart as a trustworthy alternative to Geckoboard. Our standout features include effortless integration with a diverse selection of business applications, real-time data updates, and the ability to create user-friendly, customizable dashboards.
Key Features
- Visualizes key metrics through customizable charts and graphs to enhance data insights and decision-making.
- Ensures seamless data flow with integration with prevalent tools and data sources, such as Stripe, Fathom Analytics, Slack, etc.
- Avail real-time collaboration thanks to our compatibility with multiple devices.
- Evaluate specific metrics and gain insights with Minimal Dashboard’s drill-down capabilities.
Pricing
- A free trial is available for 30 days.
- Solo Plan: $15/month for individuals (1 dashboard, 10 metrics, 1 user).
- Startup Plan: $39/month for teams (5 dashboards, 30 metrics, 5 users).
- Business Plan: $99/month for data-driven companies (20 dashboards, 100 metrics, 50 users).
Pros
- The dashboard is easy to navigate, allowing users to quickly access key metrics.
- Cost-efficient and budget-friendly plans for small businesses and startups looking to manage their data without incurring high costs.
- Users can tailor their dashboards to focus on the most relevant metrics.
Cons
- The limited features of the free plan may not be sufficient for the needs of larger organizations.
2. Databox
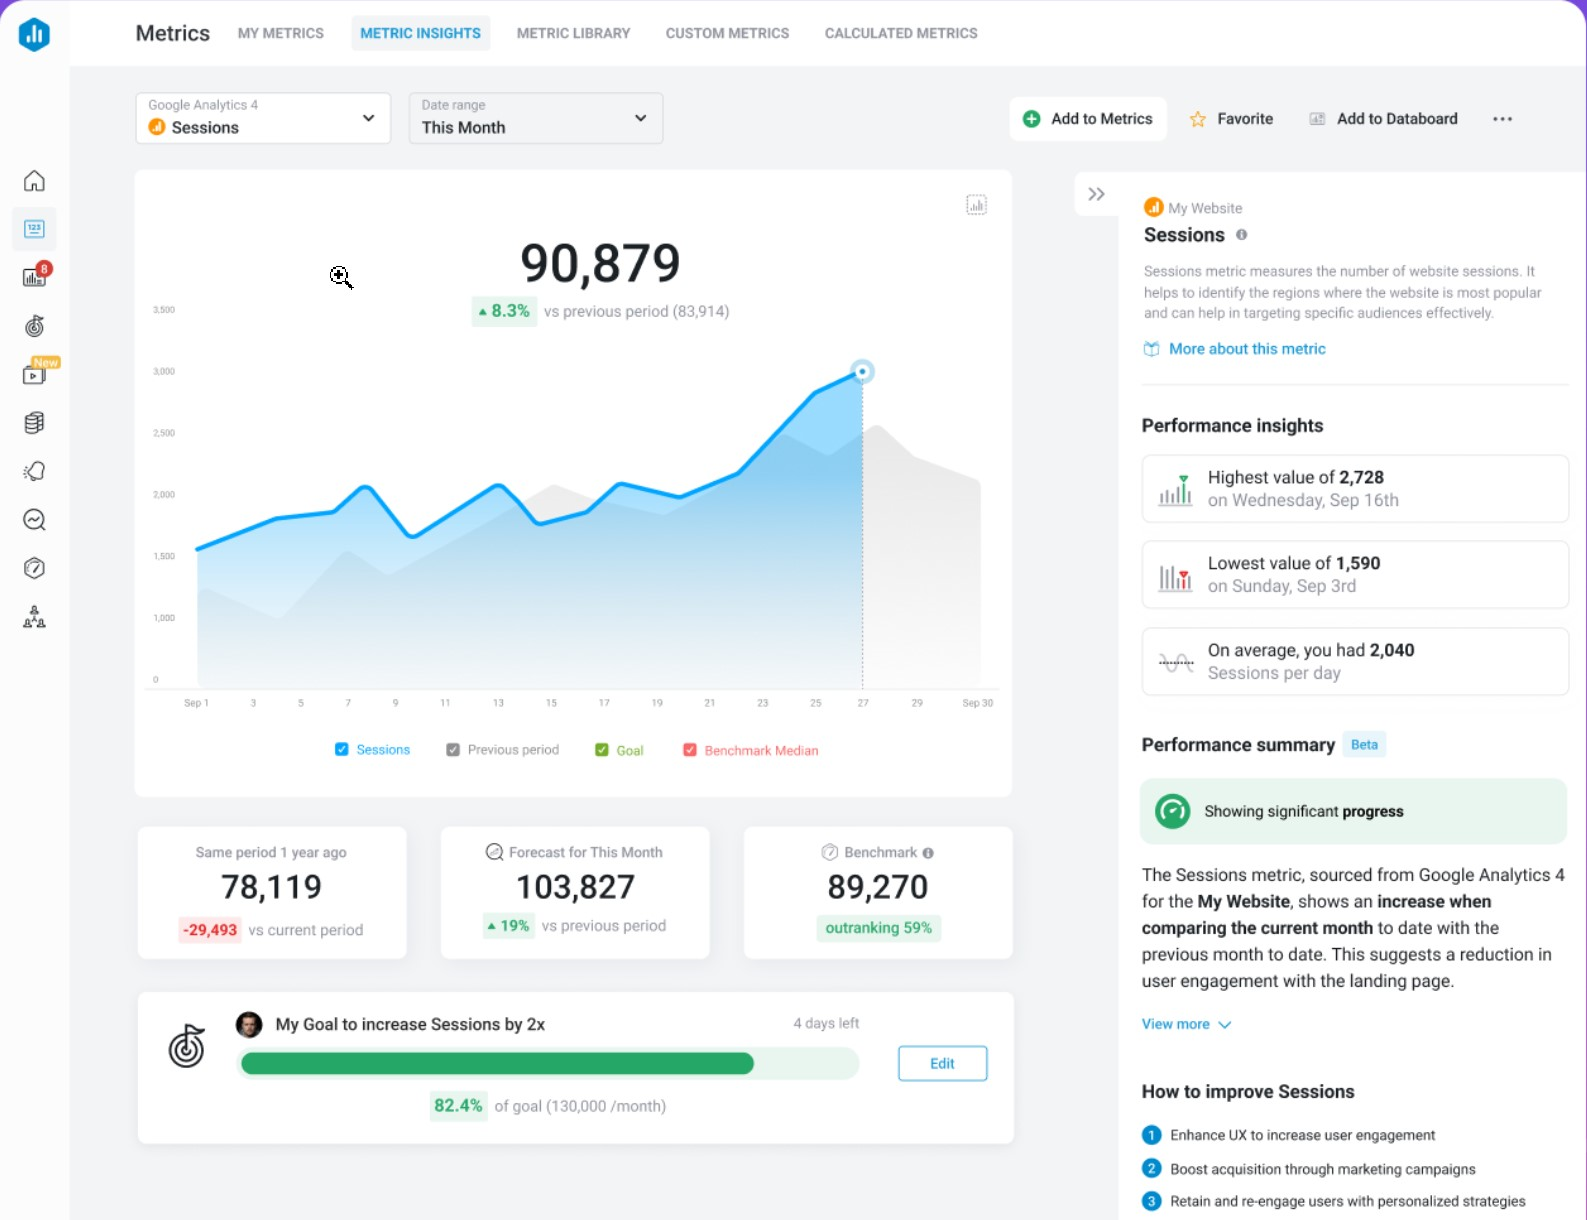
Trusted by over 20,000 business owners, Databox is a powerful data visualization tool that allows you to combine metrics from multiple sources into a single view. Its real-time data and intuitive interface make it ideal for tracking KPIs and visualizing metrics for quick, actionable insights.
Key Features
- Access over 300 pre-built templates to create and customize aesthetic dashboards.
- Get daily or weekly updates on critical metrics using scorecard features.
- Use over 70 one-click integrations, including HubSpot, Google Analytics, Facebook, etc.
- Track and assess your current performance against set goals with the goal-tracking feature.
Pricing
- Databox offers a free plan for up to three data sources.
- The paid plans have four tiers starting at $47/month.
Pros
- Easy to set up and user-friendly interface.
- The mobile app lets you check your dashboards anytime and track KPIs from anywhere.
- Excellent, solid customer support, including dedicated account managers for premium users.
- Exceptional alert system that notifies of anomalies in the data immediately.
Cons
- Not suitable for highly complex data analysis.
- Bugs and throughput issues or lags when editing custom metrics.
3. Zoho Analytics
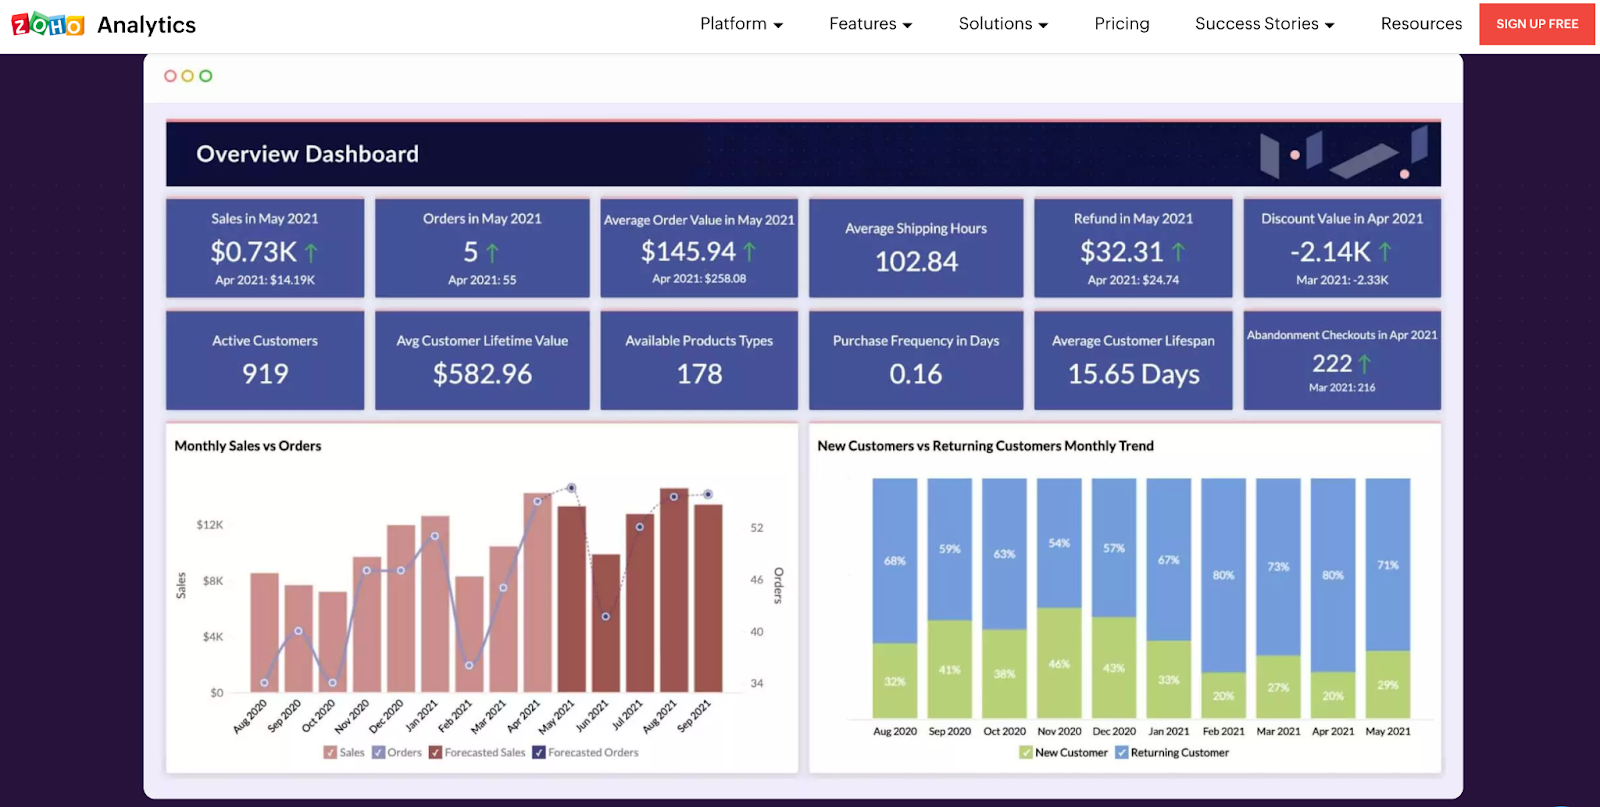
Zoho Analytics offers powerful data visualization and analytics capabilities with extensive customization options. With advanced analytics features like AI-driven insights, customizable reports, and drag-and-drop visualizations, Zoho Analytics is an able Geckoboard alternative for businesses looking to go beyond simple data display to unlock strategic insights and make informed decisions.
Key Features
- Centralize data from various platforms as Zoho offers integration with over 500 data sources, including Zoho apps, Salesforce, Google Analytics, and QuickBooks.
- Get insights, predictions, and automated anomaly detection with Zia, the AI assistant.
- Customize your reports with numerous types of charts, tables, and widgets.
- Embed Zoho Analytics dashboards into websites, portals, and applications, providing an integrated analytics experience.
Pricing
- Zoho offers a 15-day trial, and it has a free plan, too, for small reporting needs.
- The paid plans start at $22/month for 2 users.
Pros
- Competitive pricing makes it accessible for small to mid-sized businesses, with scalable plans for larger enterprises.
- Zoho Analytics goes beyond basic data visualization, thanks to AI-powered insights and SQL querying.
- A comprehensive collection of APIs and self-service BI for a highly customizable analytical solution with low-code capabilities.
- Adept at handling large data sets.
Cons
- Advanced functionalities require training, but tutorials and webinars are lacking.
- Limited data visualization options.
4. Microsoft Power BI
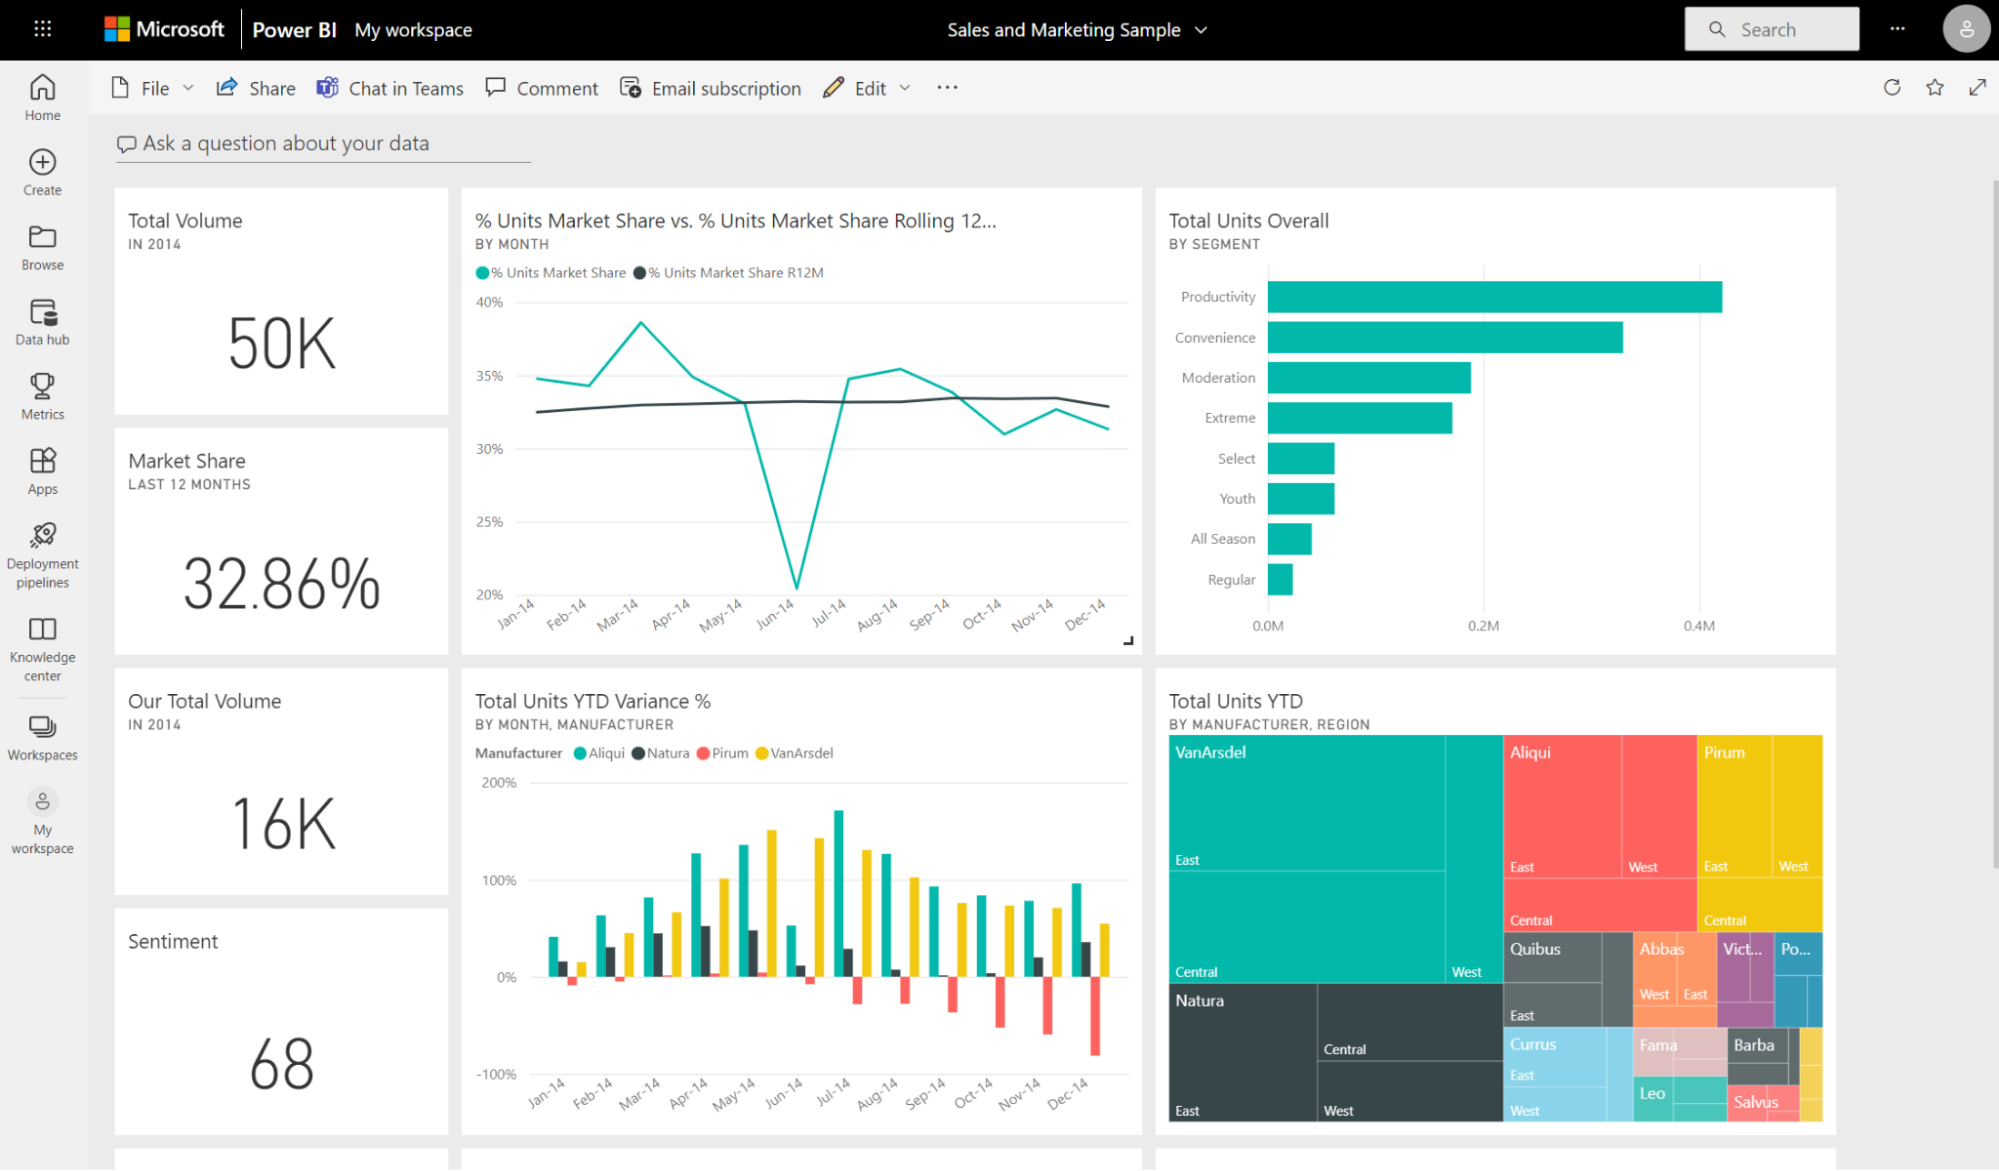
Microsoft Power BI is a powerful data visualization and business intelligence tool that helps organizations transform raw data into actionable insights. It is a robust tool that is especially popular among organizations that are already using the Microsoft suite of products. Power BI offers extensive features for data visualization, analytics, and business intelligence.
Key Features
- Create a single source of truth for your business data needs, thanks to integrations with various data sources and other Microsoft products.
- Generate insights and reports through natural language queries using the CoPilot AI assistant.
- Create detailed, interactive dashboards and reports featuring a range of visual options, such as line graphs, bar charts, and heat maps.
- Delve further into data and identify patterns using advanced functionalities such as quick measures, forecasting, grouping, and clustering.
Pricing
- Power BI offers a free trial.
- The paid plans start with Power BI Pro, which costs $10 per user/month, while Power BI Premium offers more features and starts at $20 per user/month.
Pros
- Real-time data streaming enables you to monitor ongoing operations.
- In-depth integration with Microsoft 365 allows easy sharing through Teams, SharePoint, and other Microsoft tools.
- Easy to use with a wide range of visualization options.
- Extensive documentation, training options, and a dedicated community for the tool.
Cons
- A steep learning curve for advanced features, such as DAX, power query, data modeling, etc.
- Performance can be slow with very large data sets.
5. Domo
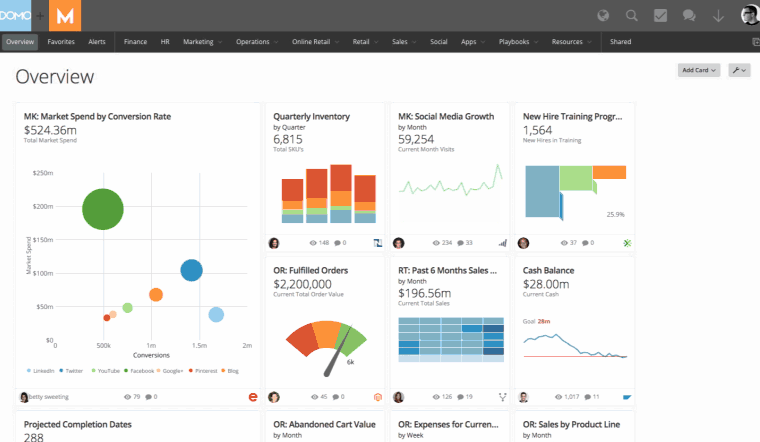
Domo is a reliable cloud-based data visualization and BI tool that helps organizations manage, analyze, and visualize data from multiple sources in real time. It’s well-suited for companies that need to integrate and analyze data from various systems and scale their analytics across teams and departments.
Key Features
- Pull data from popular tools like Salesforce, Google Analytics, and AWS, thanks to over 1,000 pre-built connectors.
- Clean, combine, and transform data directly within the platform with built-in ETL (Extract, Transform, Load) capabilities.
- Forecast trends and derive actionable insights using machine learning models and predictive analytics.
- Discuss data insights and share dashboards with collaborative features like chat, notifications, and project tracking.
Pricing
- Domo offers a free trial for 30 days.
- Paid plans are not publicly listed; must contact sales team.
Pros
- Extremely scalable and suited for large organizations.
- The visualizations, charts, and dashboards are easy to use and understand.
- Strong data integration capabilities.
- Domo’s Knowledge Base is a great resource for new users.
Cons
- The interface can be overwhelming due to its extensive features.
- Limited themes can make almost all the dashboards look a bit similar.
6. Tableau
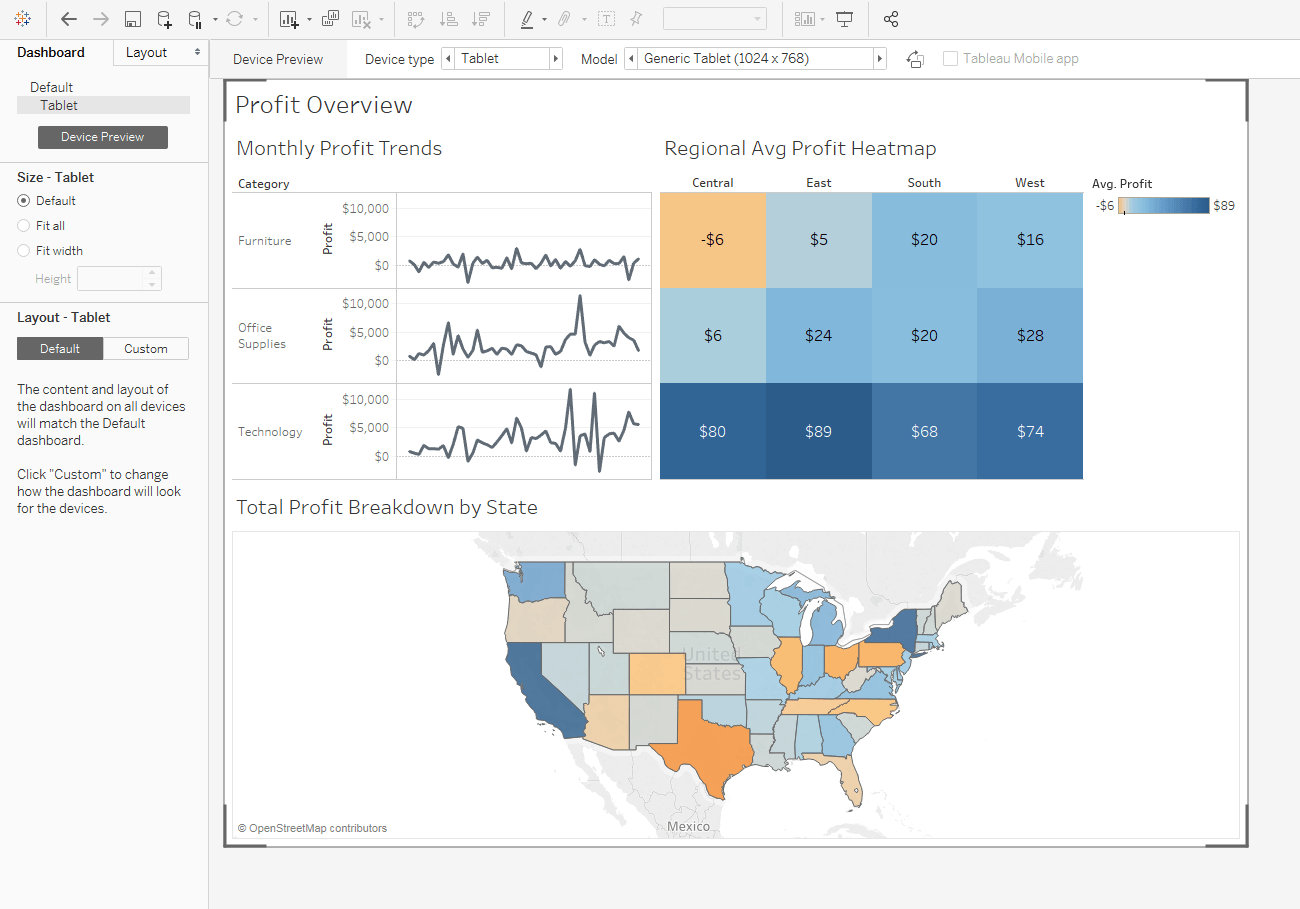
Acquired by Salesforce in 2019, Tableau is a powerful data visualization tool that offers an extensive array of visualization capabilities and advanced analytics features, making it an excellent choice for businesses looking for in-depth insights from their data. It’s especially popular for its versatility, whether for quick exploratory analysis or building comprehensive, interactive reports to share across teams.
Key Features
- Create complex visualizations without coding, thanks to its user-friendly interface.
- Make use of predictive analysis, trend lines, and powerful statistical tools.
- Build and customize dynamic dashboards that can be shared across teams.
- Share reports and dashboards easily with deep integration into platforms like Slack and Microsoft Teams.
Pricing
- A free trial is available.
- Tableau Viewer: $15/user/month for dashboard creation and interaction.
- Tableau Explorer: $42/user/month for data exploration, visualization, and full-service analytics.
- Tableau Creator: $75/user/month for full feature access, including data preparation, management, and insights.
Pros
- Supports diverse and complex visual types, from basic charts to heat maps and geographical maps, allowing for rich data storytelling.
- Experience the power of a supportive community and access to a wealth of resources, guides, and more.
- Intuitive and easy to use, especially for complex data sets.
- Highly customizable, with powerful visualization and analytics capabilities.
Cons
- Tableau doesn’t perform ETL as robustly as some other tools.
- Compared to some other tools like Power BI, Tableau has limitations in customizing certain visual elements.
Minimal Dashboard: The Geckoboard Alternative for All Your Data Requirements
When picking a data visualization tool that’s an appropriate alternative to Geckoboard, you must consider your unique business requirements, budget, and technical know-how.
For instance, Tableau is suitable for delving into detailed analytics and tailoring visualizations to your needs. At the same time, Power BI stands out as an accessible and user-friendly choice for those already in the Microsoft ecosystem.
If you consider everything you require in a data visualization tool, then Minimal Dashboard emerges as a compelling alternative to Geckoboard for businesses seeking a user-friendly, customizable solution.
Our seamless integration with a wide range of business apps, real-time data updates, and user-friendly, customizable dashboards help businesses visualize critical metrics in one place, making it easy to track performance at a glance. For teams looking for simplicity without sacrificing powerful insights, we offer an accessible and effective way to stay on top of essential data.
