What we cover in this article
Unlock SaaS success by tracking essential metrics with Minimal Dashboard. Discover key performance indicators like churn rate, MRR, and CAC to drive growth, optimize customer satisfaction, and make informed decisions. Simplify data consolidation and visualize your metrics effortlessly for a clearer path to sustainable success. Sign up for a free trial today!
Contents
- Introduction
- Why Listen to Us?
- What Are SaaS Metrics?
- Essential Metrics SaaS Companies Must Track
- Track Your SaaS Metrics With Minimal Dashboard
Introduction
Tracking the right SaaS metrics is essential for driving growth and ensuring long-term success. Without clear insights into your performance, you risk missing opportunities for improvement and expansion.
In this Minimal Dashboard article, we will explain the essential SaaS metrics that every business should monitor, detailing their significance, how to track and calculate them, and how they contribute to informed decision-making.
But first…
Why Listen to Us?
At Minimal Dashboard, we streamline SaaS metrics tracking by consolidating data from various sources into a single, real-time dashboard. With our expertise in data consolidation, we understand precisely which metrics are essential for driving SaaS success.

What Are SaaS Metrics?
SaaS metrics are key performance indicators (KPIs) that provide insights into the health, growth, and profitability of a Software-as-a-Service (SaaS) business. These metrics are essential for tracking performance in areas like customer retention, revenue generation, and operational efficiency.
For SaaS companies, monitoring these metrics is critical. The subscription-based model depends on long-term customer relationships, and SaaS metrics offer a clear view of how effectively your company is attracting, converting, and retaining customers.
Key reasons why SaaS metrics matter:
- Identify Trends: SaaS metrics help spot both positive trends and potential issues early on.
- Data-Driven Decisions: They empower you to make informed, data-backed decisions.
- Optimize Customer Satisfaction: By understanding customer behavior, you can fine-tune strategies to boost satisfaction and reduce churn.
- Drive Revenue: These metrics help identify growth opportunities and areas for improvement in your revenue streams.
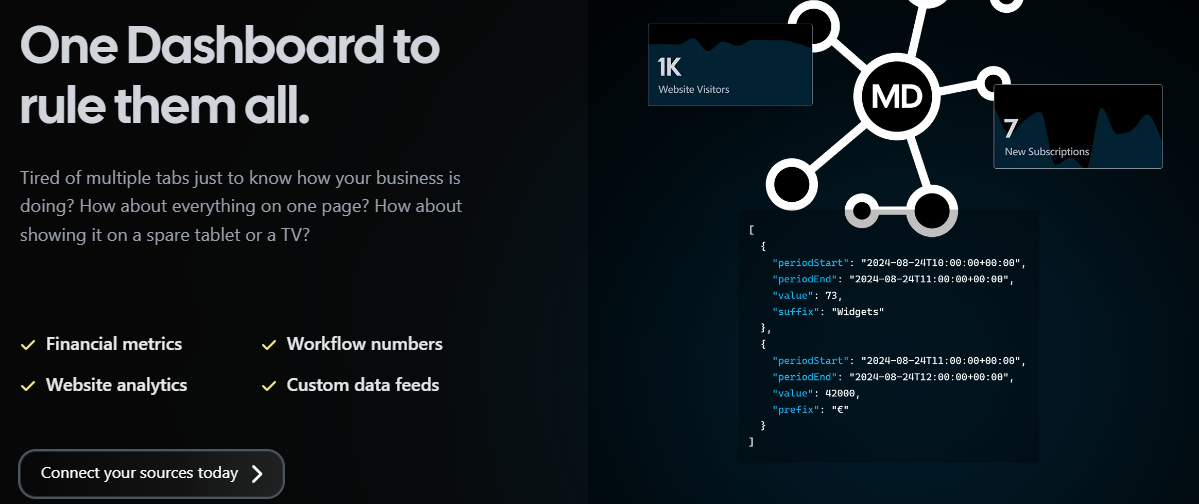
Minimal Dashboard simplifies tracking these essential metrics by consolidating data from multiple platforms into one real-time dashboard.
With automatic updates and seamless integration with tools like Stripe and Google Analytics, you get the insights you need to make data-driven decisions and optimize your SaaS business for growth.
Essential Metrics SaaS Companies Must Track
1. Churn Rate
Churn rate, or customer churn, represents the percentage of customers who cancel their subscriptions within a given period, usually monthly or annually. It is a key indicator of product satisfaction and overall business stability.
There are two types of churn to track:
- Customer churn: The number of customers lost.
- Revenue churn: The percentage of revenue lost due to cancellations or downgrades.
Here’s the formula for churn rate:
Churn Rate = (Number of customers lost ÷ Total number of customers at the beginning of the period) × 100
A high churn rate is a red flag that suggests problems with your customer experience—whether it’s product performance, pricing, or customer service. It highlights areas that need improvement to retain customers. Lowering churn is crucial for consistent growth, as acquiring new customers can be costly.
Churn is also essential for revenue forecasting in SaaS businesses. For example, suppose you start the month with 24,000 customers, and each customer pays $50 monthly. This gives you a monthly recurring revenue (MRR) of:
MRR = 24,000 customers × $50 = $1,200,000
If 1,800 customers cancel their subscriptions during the month, your churn rate would be:
Churn Rate = (1,800 ÷ 24,000) × 100 = 7.5%
This means that you would lose $90,000 in revenue for that month (1,800 customers × $50). If you don’t manage to acquire new customers to offset this loss, your revenue will drop to:
New MRR = $1,200,000 - $90,000 = $1,110,000
Understanding churn helps you anticipate revenue changes and develop strategies to improve customer retention.
2. Monthly Recurring Revenue (MRR)
Monthly Recurring Revenue (MRR) is the lifeblood of any SaaS company. It represents the predictable, recurring revenue generated each month from subscriptions.
Monitoring MRR helps businesses prioritize long-term contracts over short-lived sales, allowing them to focus on sustainable growth. By comparing MRR from different periods, companies can uncover trends and opportunities for development, providing a clearer path to future success.
The formula for calculating MRR is:
MRR = (Number of customers × Average revenue per customer)
For example, if you have 5,000 customer accounts each paying $20 monthly, your MRR would be:
MRR = 5,000 × $20 = $100,000
Tracking MRR not only helps in forecasting future revenue but also aids in identifying the effectiveness of marketing strategies and customer retention efforts.
3. Annual Recurring Revenue (ARR)
Annual Recurring Revenue (ARR) is like the big brother of Monthly Recurring Revenue (MRR). It provides a comprehensive snapshot of your business’s yearly performance, smoothing out any fluctuations in monthly results.
While MRR gives you immediate insights into monthly performance, ARR allows you to focus on long-term strategies. It indicates the company’s overall revenue trajectory and is critical for forecasting future growth and making investment decisions.
To calculate your ARR, simply multiply your monthly recurring revenue (MRR) by 12 months.
Here’s the formula:
ARR = (MRR × 12)
For example, if your MRR is $100,000, your ARR would be:
ARR = $100,000 × 12 = $1,200,000
Minimal Dashboard makes it easy to track ARR by automating the data collection from your existing platforms. With just a few clicks, you can visualize your ARR, helping you forecast long-term revenue growth with confidence.
4. Customer Acquisition Cost (CAC)
Customer Acquisition Cost (CAC) is a vital B2B SaaS metric that measures the total cost of acquiring a new customer. This metric includes various expenses, such as marketing costs, sales efforts, salaries, and commissions. CAC is a key indicator of how efficiently you’re growing your customer base.
The formula for calculating CAC is:
CAC = Total Sales and Marketing Costs ÷ Number of New Customers Acquired
For example, suppose you spend $24,000 on sales and marketing programs in a month and acquire 600 new customers.
Your CAC = ($24000 ÷ 600) = $40 per customer
A decreasing CAC over time shows that your marketing efforts are getting more effective. Conversely, if your CAC begins to outpace the revenue generated from new customers, it signals potential sustainability issues in your growth strategy.
Generally, investors prefer companies that can keep their CAC low, as it suggests efficient customer acquisition and a healthier bottom line.
5. Customer Lifetime Value (CLV)
Customer Lifetime Value (CLV) predicts the total revenue a business can expect from a customer over the lifetime of their relationship. This metric helps you understand the long-term value of a customer and determine how much you should invest to acquire them.
The formula for calculating CLV is:
CLV = Average Revenue per Customer × Average Customer Lifespan
For example, if the average revenue per customer for a SaaS business is $500 and the average customer lifespan is ten months, the CLV would be:
CLV = $500 × 10 = $5,000
A high CLV indicates that your business excels at retaining customers, allowing you to recoup more than what you spent to acquire them. Focusing on boosting CLV through effective customer retention strategies is crucial for achieving long-term success and profitability.
Minimal Dashboard integrates seamlessly with popular services like Stripe, Salesforce, Google Analytics, HubSpot, and more, allowing you to pull essential metrics like MRR, churn rate, CAC, CLV, etc., from the tools you already use. This integration provides a holistic view of your customer relationships and financial health, allowing for more informed decision-making.

6. Net Revenue Retention (NRR)
NRR measures the total revenue retained from existing customers, accounting for upsells, cross-sells, and downgrades, excluding new customers. It’s a crucial metric for evaluating how effectively you’re boosting revenue from your current customer base.
The formula for calculating NRR is:
NRR = ((MRR at the Beginning of the Month + Expansion MRR − Churned MRR) ÷ MRR at the Beginning of the Month) × 100
In this formula:
- Expansion MRR refers to the additional revenue generated from existing customers through upgrades, add-ons, or other purchases beyond their original subscriptions.
- Churned MRR accounts for revenue lost from customers who downgraded or canceled their subscriptions.
For example, suppose your company’s MRR last month was $5,000, with an expansion revenue of $1,000. If you experienced churn and downgrades amounting to $1,500, the calculation would be:
NRR = (($5,000 + $1,000 - $1,500) ÷ $5,000) × 100 = 90%
An NRR of 90% indicates that your company is not currently experiencing growth, as the revenue lost from churn exceeds the revenue gained from expansions.
Conversely, if your NRR exceeds 100%, it signifies that your existing customers are consistently contributing more revenue over time, demonstrating excellent potential for scalability and customer satisfaction.
Minimal Dashboard consolidates your customer data, including expansions, churn, and downgrades, so you can easily track NRR. This real-time visibility into your revenue retention empowers you to create strategies for upselling and minimizing churn.
7. Gross Margin
Gross margin reflects the percentage of revenue remaining after accounting for the direct costs of delivering your SaaS product, including expenses like hosting, customer support, and development.
The formula for calculating Gross Margin is:
Gross Margin = ((Revenue − Cost of Goods Sold) ÷ Revenue) × 100
A high gross margin (typically above 70-80%) is ideal for SaaS businesses, as it suggests that most of the revenue can be reinvested in growth and product development.
Maintaining a strong gross margin is essential for the long-term sustainability of a SaaS company, as it provides the financial flexibility needed to innovate, improve customer offerings, and compete effectively in the market.
Track Your SaaS Metrics With Minimal Dashboard
SaaS metrics offer essential insights into your business performance, profitability, and growth potential.
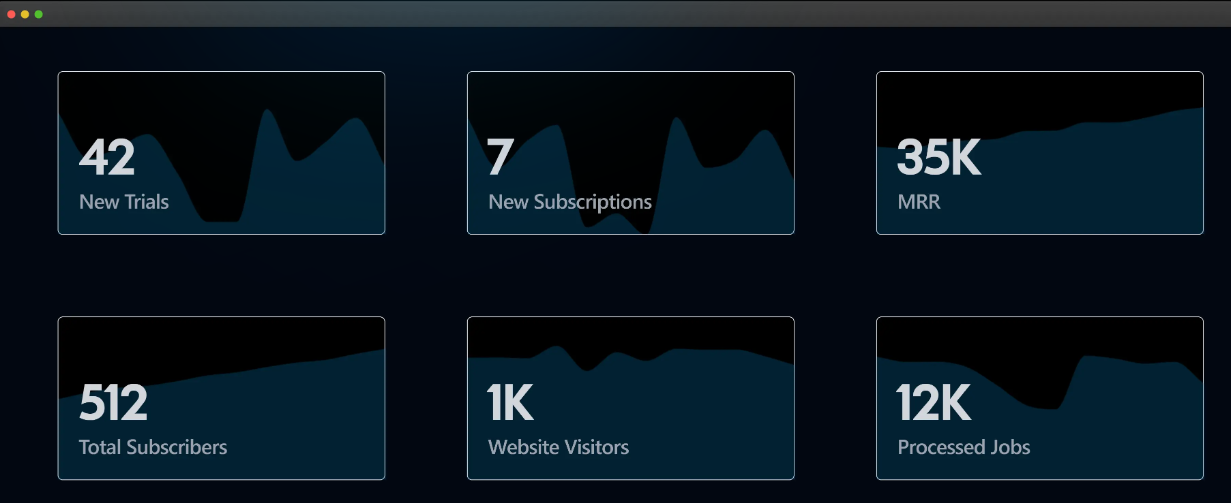
Now, imagine having all your key metrics displayed neatly on a single dashboard. That’s exactly what Minimal Dashboard provides!
We excel at measuring and tracking SaaS metrics, offering centralized data visualization that pulls key metrics into an intuitive, easy-to-use interface. Instead of hopping between platforms and manually piecing together reports, we consolidate everything in real time, giving you instant access to accurate, actionable insights.
Sign up for Minimal Dashboard today and get a 30-day free trial.
