What we cover in this article
Discover the power of SaaS dashboards with our comprehensive guide. Learn how consolidating key metrics like churn rate and monthly recurring revenue into one platform can enhance decision-making and boost performance. Explore features, benefits, and examples to streamline your business operations and drive growth effortlessly.
Introduction
Not Sure if SaaS Dashboard Could Benefit Your Business?
Many companies struggle to stay on top of critical metrics like churn rate, customer acquisition cost, or monthly recurring revenue, which leads to missed growth opportunities.
By consolidating your key metrics in one place, a SaaS dashboard can offer the clarity you need to make smarter, data-driven decisions that boost performance.
In this Minimal Dashboard article, we will walk you through everything you need to know about SaaS dashboards, from what they are to how they can benefit your business.
Why Listen to Us?
At Minimal Dashboard, we combine SaaS expertise with powerful data visualization tools, offering a streamlined way to track and assess your business performance. Our customizable options allow you to configure the dashboard to suit your specific needs, ensuring that key metrics such as sales, traffic, and customer behavior, are readily available in real-time.

What is a SaaS Dashboard?
A SaaS (Software as a Service) dashboard is a visual interface that aggregates and displays essential metrics specifically related to SaaS businesses. These dashboards provide a real-time overview of key performance indicators (KPIs) that help teams monitor the health and growth of their subscription-based services.
The primary purpose of a SaaS dashboard is to give stakeholders insights into vital metrics, such as:
- Monthly Recurring Revenue (MRR): Tracks predictable revenue from subscriptions.
- Churn Rate: Measures the percentage of customers who cancel their subscriptions within a given period.
- Customer Acquisition Cost (CAC): Calculates the cost associated with acquiring a new customer.
- Customer Lifetime Value (CLTV): Estimates the total revenue expected from a customer over the duration of their relationship with the business.
- Usage Statistics: Monitors how often customers engage with the software, helping identify trends and areas for improvement.
By centralizing these metrics in one accessible platform, SaaS dashboards enable teams to make informed decisions quickly. They often come with customization options, allowing users to tailor the displayed metrics to their specific needs, ensuring that the most relevant data is readily available.
Tools like Minimal Dashboard can help create effective SaaS dashboards. Its integration capabilities allow businesses to pull data from various sources, including payment processors, customer relationship management (CRM) systems, and marketing tools, providing a comprehensive view of SaaS business performance.

Key Features of SaaS Dashboard
1. Key Performance Indicators (KPIs)
The dashboard should prominently feature critical SaaS metrics like Monthly Recurring Revenue (MRR), Customer Churn Rate, Customer Acquisition Cost (CAC), and Customer Lifetime Value (CLTV). These KPIs provide a quick overview of business health and growth.
2. Real-Time Data Updates
An effective SaaS dashboard displays real-time data to ensure users have the most current information. This feature allows teams to respond promptly to changes in customer behavior or market conditions.
Minimal Dashboard excels in providing real-time updates by consolidating data from multiple sources, ensuring your team stays informed and ready to act swiftly.
3. Customizable Views
Dashboards should offer customization options, enabling users to choose which metrics to display based on their specific roles or objectives. This flexibility ensures that relevant data is prioritized for each user.
4. Visualizations
Utilizing various data visualizations, such as graphs, charts, and heat maps, makes it easier to interpret metrics at a glance. Visual representations help identify trends and patterns in the data quickly.
5. Data Integration
The ability to pull data from multiple sources is crucial for a comprehensive view of SaaS performance. Integration with payment processors, CRM systems, and marketing tools ensures that all relevant metrics are captured and displayed.
6. Alerts and Notifications
Incorporating alerts for significant changes in key metrics (like spikes in churn rate or drops in MRR) helps users stay informed about potential issues that may require immediate attention.
7. Historical Data Analysis
Effective dashboards allow users to view historical data to identify trends over time. Comparing current metrics with past performance helps in strategic planning and forecasting.
Benefits of Using SaaS Dashboard
1. Centralized Data Access
A SaaS dashboard consolidates various metrics into one view, reducing the need to navigate multiple tools. For example, instead of switching between a payment processor to check MRR and a CRM to analyze customer engagement, teams can access all critical information from a single dashboard, streamlining their workflow.
Minimal Dashboard excels in centralizing these data points, connecting seamlessly to your most-used apps, so your team can focus on growth instead of managing different systems.
2. Enhanced Decision-Making
With real-time access to important KPIs like Churn Rate and Customer Lifetime Value, teams can make informed decisions quickly. For instance, if the dashboard shows a rising churn rate, the customer success team can promptly investigate and implement retention strategies before the situation worsens.
3. Data Visualization for Quick Insights
Visual representations of data, such as graphs and charts, make it easier to interpret complex information. For example, a line graph showing MRR growth over time can quickly illustrate trends, enabling stakeholders to identify peak sales periods or the impact of marketing campaigns.
4. Improved Collaboration
SaaS dashboards facilitate collaboration among teams by providing a shared view of key metrics. For instance, sales and marketing teams can use the same dashboard to monitor conversion rates from campaigns, fostering better communication and alignment on strategies.
5. Enhanced Customer Insights
A SaaS dashboard can integrate user data, enabling teams to analyze customer behavior patterns. For example, tracking usage statistics alongside customer acquisition data can reveal which features are most popular, guiding product development and marketing strategies.
6. Scalability and Adaptability
As a business grows, its metrics and data sources will evolve. SaaS dashboards can easily integrate new tools and metrics, allowing teams to adapt their monitoring without significant disruptions. This scalability ensures that businesses can continue to track relevant data as they expand.
Examples of Popular SaaS Dashboards
1. Minimal Dashboard
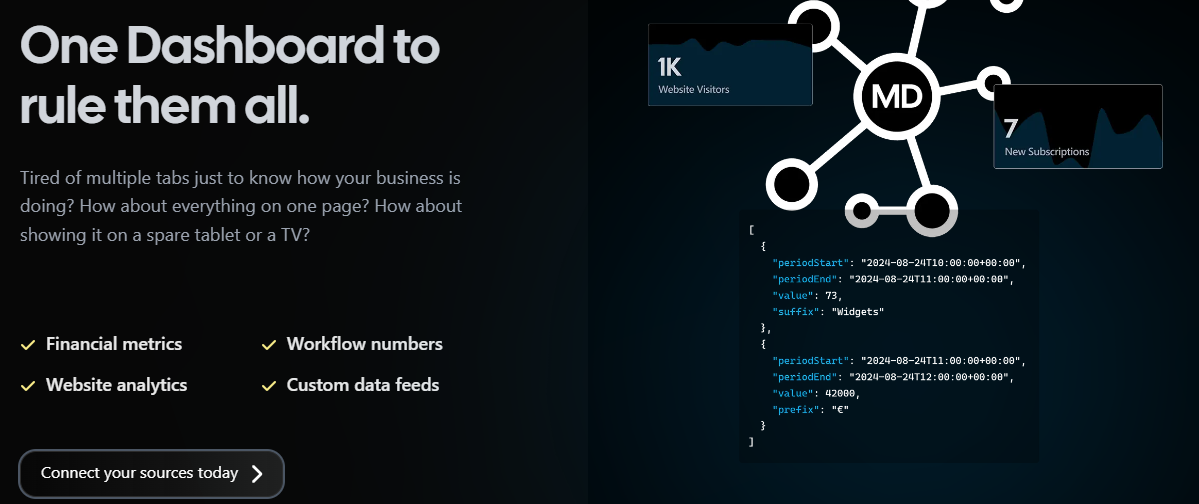
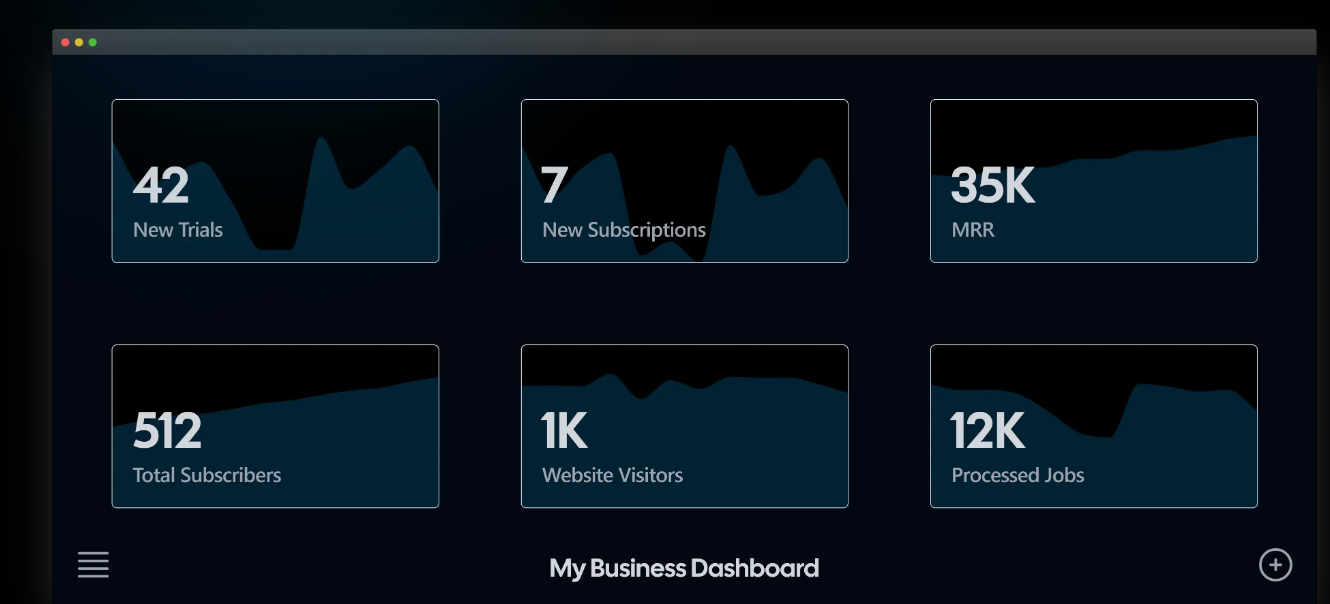
Minimal Dashboard offers a streamlined solution for displaying key SaaS metrics all in one place. Designed for efficiency, it allows users to stay informed, uncover trends, and evaluate the impact of their business decisions without the hassle of toggling between multiple tabs.

Key Features
- All-in-One Dashboard: Centralizes essential metrics in a single view, allowing teams to access crucial information effortlessly.
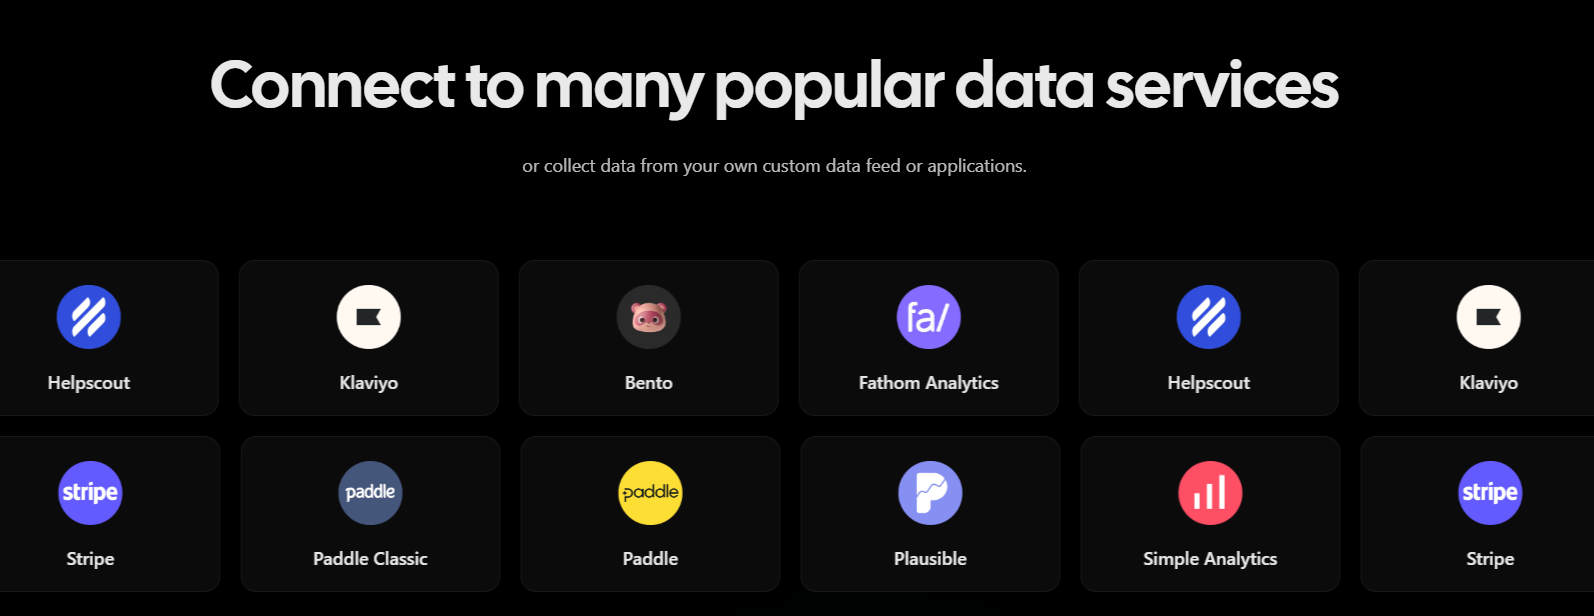
- Real-Time Data Integration: Connects with popular services like Stripe, Klaviyo, and Fathom Analytics, providing up-to-date insights and ensuring you always have the latest data at your fingertips.
- Customizable Metrics: Users can personalize their dashboard to display the most relevant metrics, tailoring the information to meet specific business needs and goals.
- User-Friendly Interface: The dashboard is designed for simplicity and ease of use, allowing team members of all technical backgrounds to navigate and interpret data without difficulty.
2. Geckoboard
Geckoboard is a user-friendly tool designed to help business leaders create and share real-time KPI dashboards that enhance team performance. By visualizing key metrics in an easily digestible format, Geckoboard keeps everyone aligned around important milestones and fosters a culture of accountability.
Key Features
- Real-Time Data Integration: Geckoboard connects to over 90 popular business tools, allowing users to aggregate real-time data seamlessly.
- Customizable Dashboard Design: Users can easily select and organize the metrics that matter most to their business using a drag-and-drop interface.
- KPI Visibility: The dashboard is designed to make progress against KPIs and targets unmissable, fostering motivation and focus among team members.
- Flexible Sharing Options: Geckoboard offers various ways to share insights, including display on TVs, mobile views, and scheduled snapshots via email and Slack.
3. Klipfolio
Klipfolio is a powerful dashboard tool designed to help teams build real-time, custom data visualizations and reports without the need for a data warehouse. It enables users to bring together data from over 130 sources, allowing for seamless integration and visualization of key SaaS metrics.
Key Features
- Real-Time Data Integration: Klipfolio connects with over 130 data services, ensuring that users have access to live metrics.
- Customizable Visualizations: The platform provides an extensive library of over 30 chart types and a user-friendly Klip Editor, enabling users to create visually engaging dashboards tailored to their specific metrics and goals.
- Automated Reporting: With features that allow for automated sharing of insights, Klipfolio makes it easy to distribute dashboards and reports as PDFs or images.
- Flexible Sharing Options: Klipfolio offers multiple ways to share dashboards, including published links for public or password-protected access.
Tips for Maximizing Your SaaS Dashboard Usage
1. Define Clear Objectives
Start by identifying the key metrics that align with your business goals. For instance, if your objective is to increase customer retention, focus on metrics like churn rate and customer satisfaction scores. Clearly defined objectives help in customizing the dashboard to highlight the most relevant data, making it easier for your team to track progress.
2. Utilize Real-Time Data
Make the most of real-time data integration capabilities. For example, if you’re using Minimal Dashboard, connect it to your CRM and marketing tools to monitor lead conversions as they happen. This immediate access allows your team to respond swiftly to trends, such as a sudden drop in conversion rates, and implement corrective actions quickly.
3. Encourage Team Engagement
Foster a data-driven culture by involving your team in the dashboard setup process. Encourage team members to suggest metrics they find valuable. For instance, a sales team might want to track their monthly quota attainment alongside customer feedback metrics.
When team members have a say in the metrics displayed, they are more likely to engage with the dashboard and use it in decision-making.
4. Regularly Review and Adjust Metrics
Set a schedule to review the metrics displayed on your dashboard regularly. Business needs evolve, and so should your dashboard.
For example, if your company shifts focus from acquiring new customers to improving customer lifetime value, adjust the dashboard to include relevant metrics like average revenue per user (ARPU) and upsell conversion rates. Regular reviews ensure that the dashboard remains aligned with your strategic goals.
5. Leverage Visual Customization
Take advantage of the visual customization features offered by your dashboard tool. Use color coding to highlight performance trends—for example, green for metrics that meet or exceed targets and red for those that fall short. This visual differentiation makes it easier for team members to quickly assess performance at a glance.
6. Train Your Team
Provide training sessions to ensure your team understands how to use the dashboard effectively. For instance, if you’re using Minimal Dashboard, conduct a workshop that walks team members through connecting data sources, customizing views, and interpreting metrics. Well-trained users can extract more value from the dashboard, leading to better decision-making.
7. Share Insights Across Teams
Promote transparency by sharing dashboard insights across departments. For example, a marketing team could share website traffic and conversion metrics with the sales team to help them understand the quality of leads being generated. Cross-departmental visibility fosters collaboration and alignment toward common business objectives.
Minimal Dashboard - Your Go-To SaaS Dashboard
SaaS dashboards are essential tools for business owners looking to reduce churn and increase Customer Lifetime Value (CLTV). Minimal Dashboard distinguishes itself as a top choice for those prioritizing simplicity, efficiency, and real-time insights in tracking the SaaS metrics that drive growth.
By consolidating your most critical SaaS metrics into one intuitive platform, Minimal Dashboard empowers you to monitor performance effortlessly, allowing you to respond quickly to fluctuations in customer engagement and optimize your strategies based on real-time data.
Ready to transform the way you manage your SaaS metrics? Sign up for Minimal Dashboard today.
