What we cover in this article
Unlock startup growth with AARRR metrics—Acquisition, Activation, Retention, Revenue, and Referral. This guide details their importance in tracking customer lifecycle stages and driving data-driven decisions. Learn how Minimal Dashboard streamlines the process with an integrated interface, ensuring efficient growth management and strategic insights for your business.
Contents
- Introduction
- How Can You Integrate AARRR Metrics into Your Startup’s Workflow?
- Why Listen to Us?
- What are AARRR Metrics?
- Importance of AARRR Metrics for Businesses
- Practical Implementation of the AARRR Framework in Business
- Best Practices for Tracking & Implementing AARRR Metrics
- Streamline AARRR Metrics Tracking With Minimal Dashboard
Introduction
This article provides an in-depth explanation of AARRR metrics, also called Pirate Metrics, a framework crucial for startup founders to track customer lifecycle stages: Acquisition, Activation, Retention, Revenue, and Referral. Understanding and applying these metrics are essential for driving growth and making data-driven decisions. Additionally, this guide introduces how Minimal Dashboard simplifies the tracking process with an integrated, user-friendly interface.
How Can You Integrate AARRR Metrics into Your Startup’s Workflow?
If you’re new to the startup world, you’ve likely heard of “AARRR metrics.” More than just a catchy name, AARRR metrics offer a roadmap to help startups focus on key growth stages and scale effectively.
These metrics—Acquisition, Activation, Retention, Revenue, and Referral—are vital for building a strong, sustainable business.
In this guide, we’ll break down each stage of AARRR metrics, explore why they’re essential, and show how Minimal Dashboard simplifies tracking and analysis to make growth management easier.
But first…
Why Listen to Us?
At Minimal Dashboard, we empower businesses by providing a comprehensive solution for tracking AARRR metrics—Acquisition, Activation, Retention, Referral, and Revenue—all in one unified platform. Our system seamlessly integrates into existing workflows, giving business teams immediate visibility into key performance indicators.

What are AARRR Metrics?
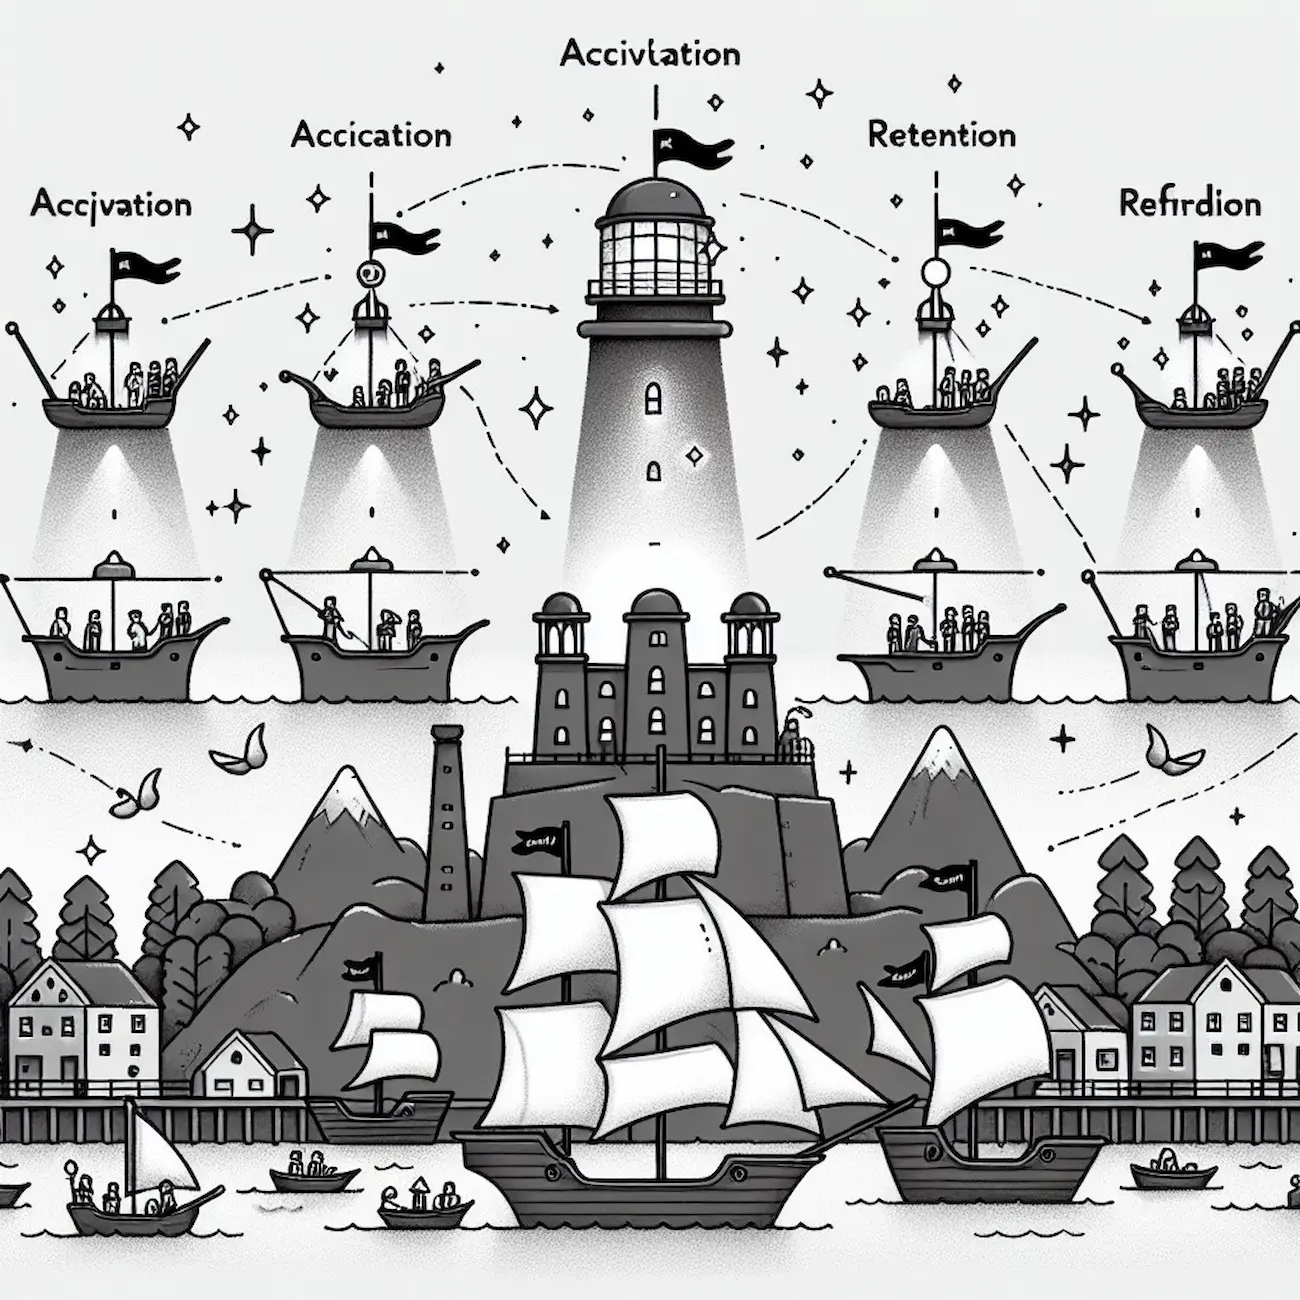
AARRR metrics, often dubbed the “Pirate Metrics” (because of the sound they make), were coined by Dave McClure, a venture capitalist and entrepreneur. They represent five key stages in a customer lifecycle that startups should diligently track. These stages include:
- Acquisition
- Activation
- Retention
- Revenue
- Referral
1. Acquisition
Acquisition refers to the process of gaining new users or customers. This could be through various channels like social media ads, search engine marketing, or word-of-mouth. In other words, it’s about getting people to discover and visit your product or service.
Acquisition metrics include:
- Number of visitors to your website
- Cost per acquisition (CPA)
- Conversion rate from various marketing channels
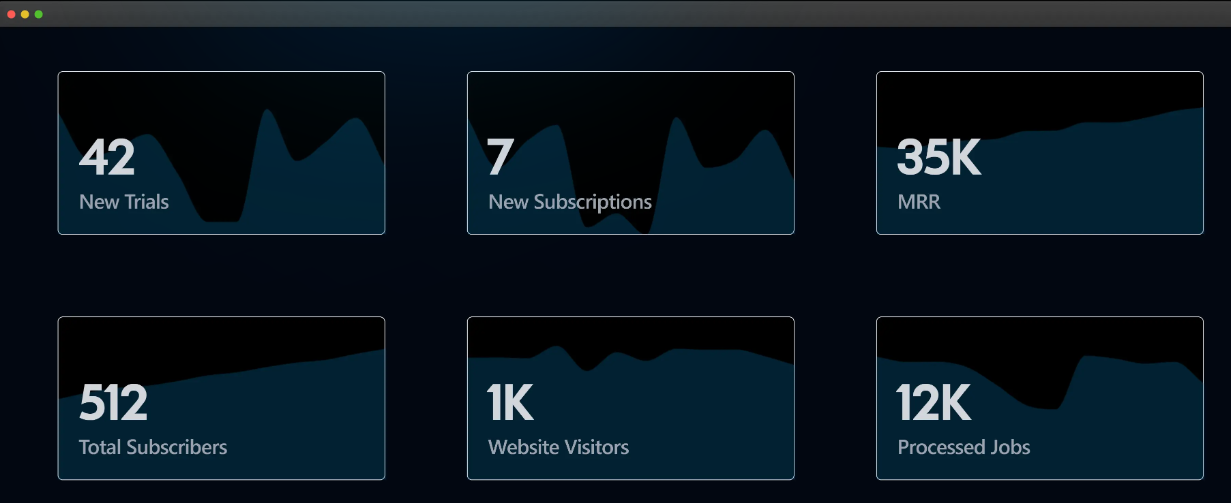
Using Minimal Dashboard, you can consolidate all acquisition metrics from different sources into a single view. This helps you monitor the effectiveness of each marketing channel in real time, track costs, and make informed adjustments to optimize spend and reach.

2. Activation
Activation measures user satisfaction with their initial experience. Did they sign up for your newsletter, download your app, or complete their first purchase? An activated user is someone who has taken a meaningful action that aligns with your business goals.
Activation could mean different things depending on the product—completing a sign-up process, making a first purchase, or experiencing the core value of the product.
Activation metrics often look at:
- User engagement rates
- Time taken for users to complete key actions
- User feedback
A high activation rate generally indicates that users find value in the product quickly, which is crucial for long-term success.
3. Retention
The next metric, Retention, focuses on keeping users engaged and coming back. It’s about building a loyal customer base that regularly interacts with your product or service. Without retention, efforts in acquisition and activation lose their long-term impact. Retention metrics include:
- Cohort analysis
- Churn rate (the percentage of users who stop using the product)
- Average customer lifespan
Minimal Dashboard integrates with various tools to visualize cohort analysis and churn rates over time. If retention drops, you can quickly identify at which points users disengage. This makes it easier to implement strategies to increase lifetime value, like feature updates or re-engagement campaigns.

4. Revenue
Revenue is the metric that quantifies the income generated from users. This can come from various sources, such as direct sales, subscriptions, or advertisements. Understanding how much revenue each user generates is crucial for assessing the financial health of your business and determining the lifetime value of customers.
Simply put, revenue measures how much money your business is generating from its users. They include:
- Average revenue per user (ARPU)
- Monthly recurring revenue (MRR)
- Total revenue growth
Understanding revenue metrics helps organizations assess their monetization strategies and identify opportunities for upselling or cross-selling to existing customers.
5. Referral
Finally, Referral measures how well your existing customers are promoting your product or service to others. This can be encouraged through referral programs or simply by providing an excellent experience that users want to share. A high referral rate indicates that customers are satisfied enough to recommend your offering, creating a cycle of organic growth.
Metrics related to referrals include the:
- Net Promoter Score (NPS)
- Referral conversion rates
- Number of new customers acquired through referrals
With Minimal Dashboard you can track referral metrics to gauge customer satisfaction and analyze which referral programs work best. If referral rates dip, you’ll have the data you need to adjust incentives and boost organic reach.
Importance of AARRR Metrics for Businesses
1. Structured Framework
For one, they provide a structured framework to evaluate your startup’s progress. By focusing on these critical stages, you can identify areas that need attention and allocate resources effectively.
2. Measurable Business Objectives
AARRR metrics also help in setting measurable business objectives. Instead of vague goals like “increase sales,” founders can aim for specific targets like “increase monthly active users by 20%.” This clarity ensures everyone in the team knows what is expected and can work together toward achieving it.
3. Adaptability
In addition, these metrics allow startups to adapt and pivot quickly if needed. By analyzing the data, founders can detect trends and patterns that may require changes in strategy. This agility is essential in the competitive startup landscape.
Practical Implementation of the AARRR Framework in Business
1. Acquisition Stage
Start by identifying where your users are coming from, whether through ads, social media, SEO, or referrals. For instance, if you notice a significant influx of users from a Facebook ad campaign, consider increasing your budget for that channel. Conversely, if SEO is yielding low traffic, you might focus on improving your website’s content and optimizing for relevant keywords to boost visibility.
2. Activation Stage
Analyze where users first experience value. For example, if your app’s onboarding process requires multiple steps, consider streamlining it. You could also implement a welcome email that guides new users on how to complete their first key action, such as setting up their profile or making a purchase. This helps users find value quickly, leading to a higher activation rate.
3. Retention Stage
Retention tracks how often users return. Minimal Dashboard can display user engagement patterns over time, letting you spot drop-off points. If you see retention rates fall after a certain period, use these insights to address why users might not be finding long-term value.
For example, you could launch a re-engagement campaign based on these metrics to keep your audience engaged, whether through targeted content, special offers, or feature updates.
4. Referral Stage
Assess how often users recommend your product to others. If you find that referral rates are low, consider implementing a referral program that rewards users for sharing your product with friends. For example, offer discounts or credits for every new customer they bring in. Additionally, make sharing easy by adding social sharing buttons within your app or website.
5. Revenue Stage
Monitor revenue to understand how your product is making money. Minimal Dashboard offers real-time tracking for metrics like Average Revenue per User (ARPU), Monthly Recurring Revenue (MRR), and total revenue growth. If revenue trends downward, the dashboard’s insights help you evaluate pricing strategies, optimize offers, or experiment with upselling and cross-selling initiatives.
Best Practices for Tracking & Implementing AARRR Metrics
1. Define Clear Goals
Establish specific and measurable objectives for each metric to guide your analysis. For instance, you might aim to increase activation rates by enhancing the user onboarding process, which could involve streamlining registration steps or providing engaging tutorials to facilitate user engagement from the outset.
2. Collect Accurate Data
Ensure data accuracy by utilizing reliable sources and high-quality analytical tools. It is crucial to regularly verify the quality of your data to avoid drawing misleading business intelligence, which could result in flawed strategic decisions. Consider implementing data validation techniques and cross-referencing multiple data points to maintain integrity.
3. Regular Monitoring
Consistently track metrics to identify and analyze trends and patterns over time. This ongoing observation allows you to make proactive adjustments and stay ahead of potential challenges. Set up automated reporting systems and dashboards to facilitate continuous monitoring and quick identification of significant changes.
4. Adapt and Iterate
Be prepared to adjust your strategies based on the valuable insights you gather. Experiment with different approaches, such as A/B testing or pilot programs, and learn from both your successes and failures. This iterative process is crucial for refining your strategies and achieving optimal results in the dynamic market landscape.
5. Share Insights with Your Team
Foster a culture of collaboration and transparency by sharing your findings and insights with your team. Encourage open discussions and brainstorming sessions to promote cross-functional problem-solving, which can drive collective success and align your team towards common goals.
Streamline AARRR Metrics Tracking With Minimal Dashboard
AARRR metrics are essential tools for startup founders. By focusing on acquisition, activation, retention, revenue, and referral, you can drive your business toward sustainable growth.
Minimal Dashboard is your ideal partner in this process. With its intuitive interface and robust integrations, the platform simplifies the tracking and analysis of each key metric. By centralizing your data, it saves time and supports faster, data-driven decisions.
Ready to take the next step? Get started with Minimal Dashboard today!
